\n
## Pie Charts: Reasoning Skills & Capabilities Breakdown
### Overview
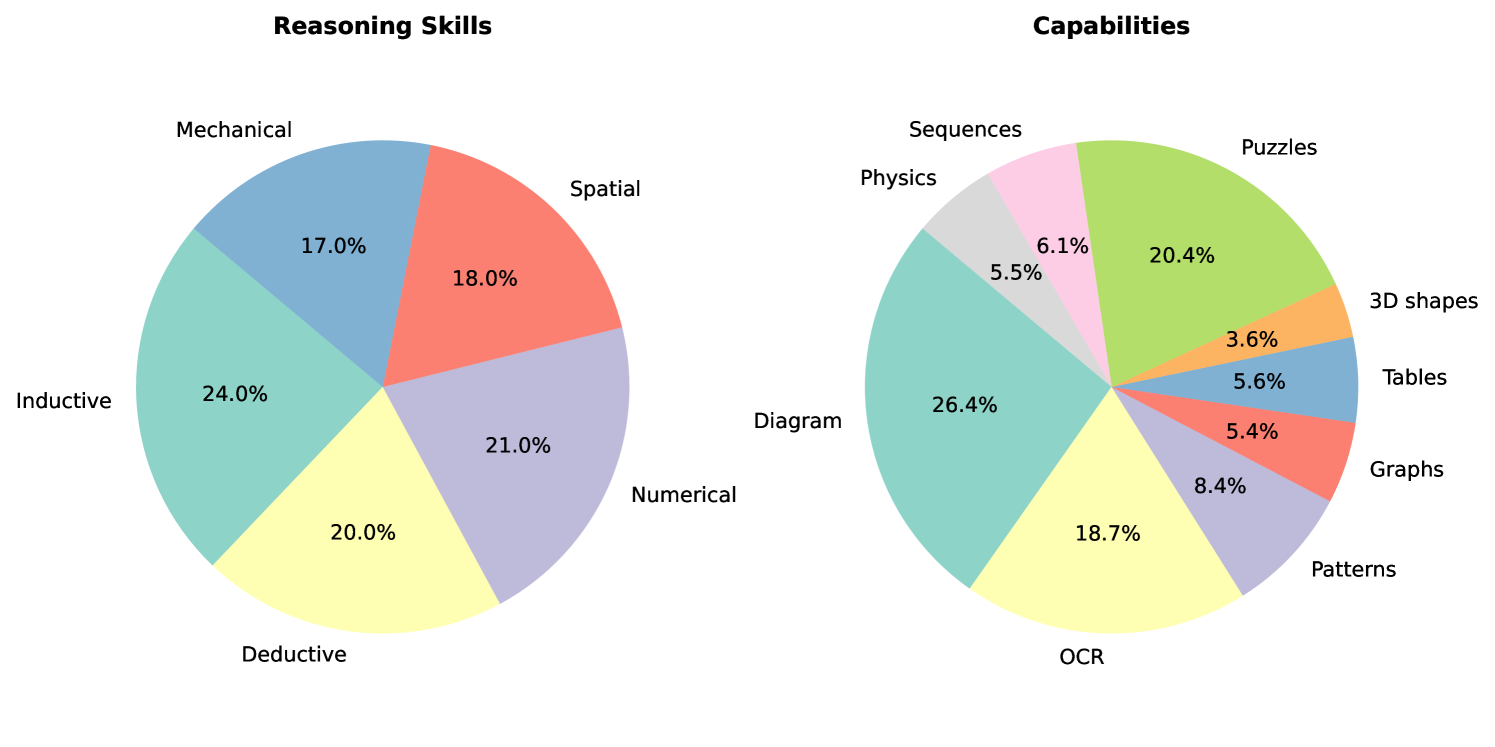
The image presents two pie charts side-by-side. The left chart details the distribution of "Reasoning Skills," while the right chart illustrates the distribution of "Capabilities." Each slice of the pie charts is labeled with a skill or capability and its corresponding percentage.
### Components/Axes
Both charts are standard pie charts with percentage values displayed directly on each slice.
**Left Chart: Reasoning Skills**
* **Title:** Reasoning Skills
* **Categories:**
* Inductive (24.0%)
* Deductive (20.0%)
* Numerical (21.0%)
* Diagram (18.0%)
* Spatial (17.0%)
* Mechanical (10.0%)
**Right Chart: Capabilities**
* **Title:** Capabilities
* **Categories:**
* OCR (26.4%)
* Patterns (18.7%)
* Graphs (8.4%)
* Tables (5.4%)
* 3D shapes (5.6%)
* Physics (6.1%)
* Sequences (20.4%)
* Puzzles (3.6%)
### Detailed Analysis or Content Details
**Reasoning Skills Chart:**
The largest segment is "Inductive" reasoning, accounting for 24.0% of the total. "Deductive" and "Numerical" reasoning are nearly equal, at 20.0% and 21.0% respectively. "Diagram" reasoning represents 18.0%, "Spatial" reasoning 17.0%, and "Mechanical" reasoning the smallest portion at 10.0%.
**Capabilities Chart:**
"OCR" is the dominant capability, representing 26.4%. "Patterns" account for 18.7%. "Graphs" represent 8.4%, "Tables" 5.4%, and "3D shapes" 5.6%. "Physics" and "Sequences" are relatively similar at 6.1% and 20.4% respectively. "Puzzles" represent the smallest portion at 3.6%.
### Key Observations
* In Reasoning Skills, no single skill overwhelmingly dominates, with the top three skills (Inductive, Deductive, and Numerical) being relatively close in percentage.
* OCR is significantly more prominent than any other capability.
* The "Puzzles" capability has the lowest representation.
* The "Mechanical" reasoning skill has the lowest representation.
### Interpretation
The data suggests a balanced distribution of reasoning skills, with inductive, deductive, and numerical reasoning being equally important. The prominence of OCR as a capability indicates a strong focus on optical character recognition, potentially for document processing or data extraction. The relatively low representation of "Puzzles" and "Mechanical" skills/capabilities might indicate areas where further development or focus is needed. The charts likely represent the breakdown of skills or capabilities within a system, a team, or a dataset. The relationship between the two charts is that the reasoning skills are used to perform the listed capabilities. The data could be used to identify strengths and weaknesses in a particular system or to guide resource allocation for skill development.