## Pie Charts: Reasoning Skills and Capabilities
### Overview
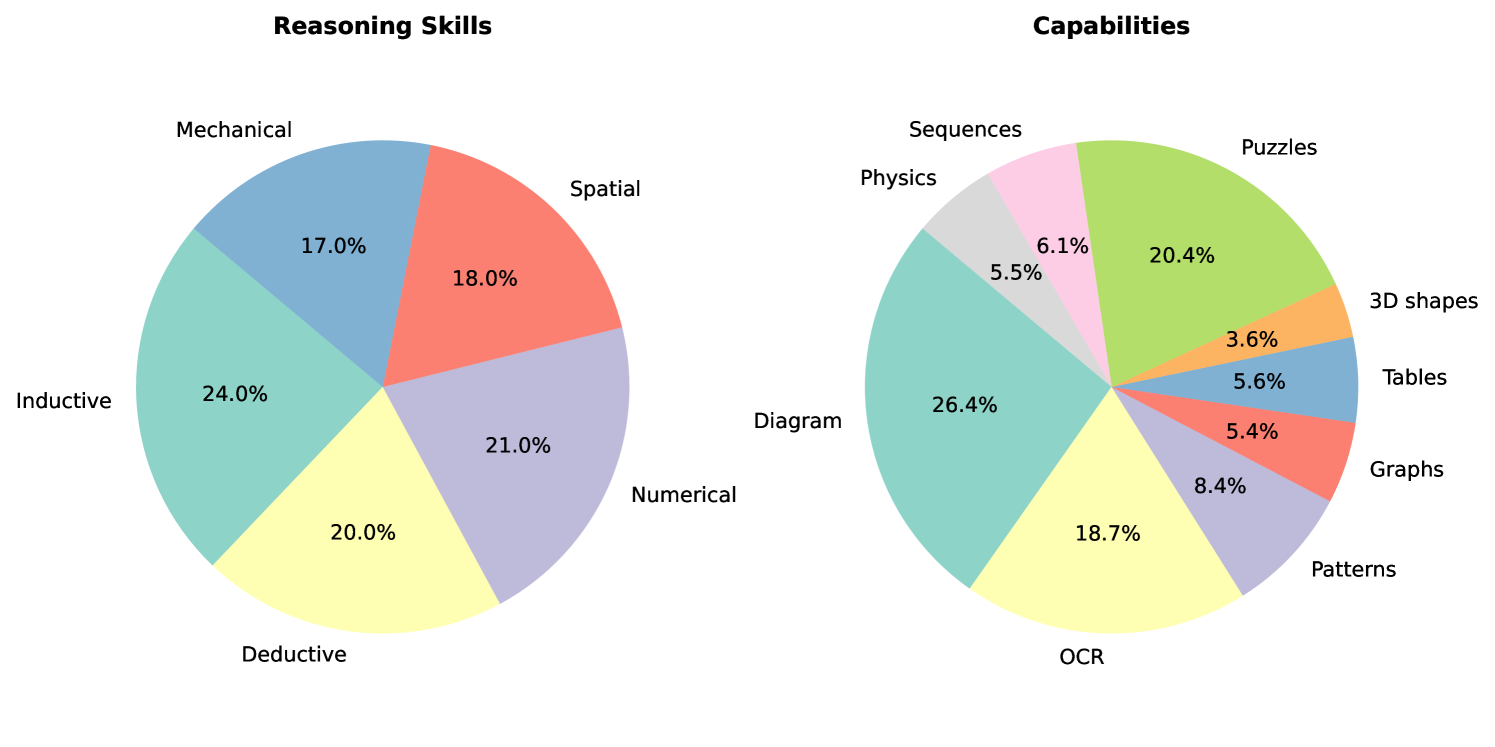
The image contains two adjacent pie charts comparing distributions of reasoning skills and capabilities. Both charts use color-coded segments with percentage labels. The left chart focuses on reasoning skills, while the right chart emphasizes capabilities.
### Components/Axes
**Left Chart (Reasoning Skills):**
- **Segments:** Mechanical (17.0%), Spatial (18.0%), Numerical (21.0%), Deductive (20.0%), Inductive (24.0%)
- **Colors:** Blue, Red, Purple, Yellow, Green
- **Text:** Percentages displayed inside segments
**Right Chart (Capabilities):**
- **Segments:** Diagram (26.4%), OCR (18.7%), Puzzles (20.4%), Patterns (8.4%), Graphs (5.4%), Tables (5.6%), Physics (5.5%), Sequences (6.1%), 3D shapes (3.6%)
- **Colors:** Green, Yellow, Purple, Red, Blue, Gray, Pink, Orange, Light Blue
- **Text:** Percentages displayed inside segments
### Detailed Analysis
**Reasoning Skills Distribution:**
1. Inductive reasoning dominates at 24.0%
2. Numerical reasoning follows at 21.0%
3. Deductive reasoning at 20.0%
4. Spatial reasoning at 18.0%
5. Mechanical reasoning at 17.0%
**Capabilities Distribution:**
1. Diagram interpretation leads at 26.4%
2. Puzzles at 20.4%
3. OCR at 18.7%
4. Patterns at 8.4%
5. Graphs at 5.4%
6. Tables at 5.6%
7. Physics at 5.5%
8. Sequences at 6.1%
9. 3D shapes at 3.6%
### Key Observations
1. **Dominant Categories:**
- Inductive reasoning (24.0%) and Diagram interpretation (26.4%) are the most prominent in their respective charts
- Both charts show a "long tail" with multiple smaller segments (<10%)
2. **Distribution Patterns:**
- Reasoning skills show a more balanced distribution (range: 17-24%)
- Capabilities show greater disparity (range: 3.6-26.4%)
3. **Color Coding:**
- Left chart uses warmer colors (red/yellow) for mid-range skills
- Right chart uses cooler colors (blue/green) for higher capabilities
- 3D shapes (3.6%) uses the smallest segment with orange color
### Interpretation
The data suggests a cognitive profile emphasizing analytical skills over mechanical aptitude, with strong inductive and numerical reasoning capabilities. The capabilities chart reveals a focus on abstract pattern recognition (Diagram, Puzzles) over concrete applications (3D shapes). The significant gap between top capabilities (26.4%) and lower ones (3.6%) indicates potential areas for skill development. The near-equal distribution of reasoning skills (within 7% range) contrasts with the capabilities' wider spread, suggesting that while foundational reasoning is balanced, applied capabilities show more specialization.