## Bar Chart: Boltzmann Law vs Measured (Oscillators) Probabilities
### Overview
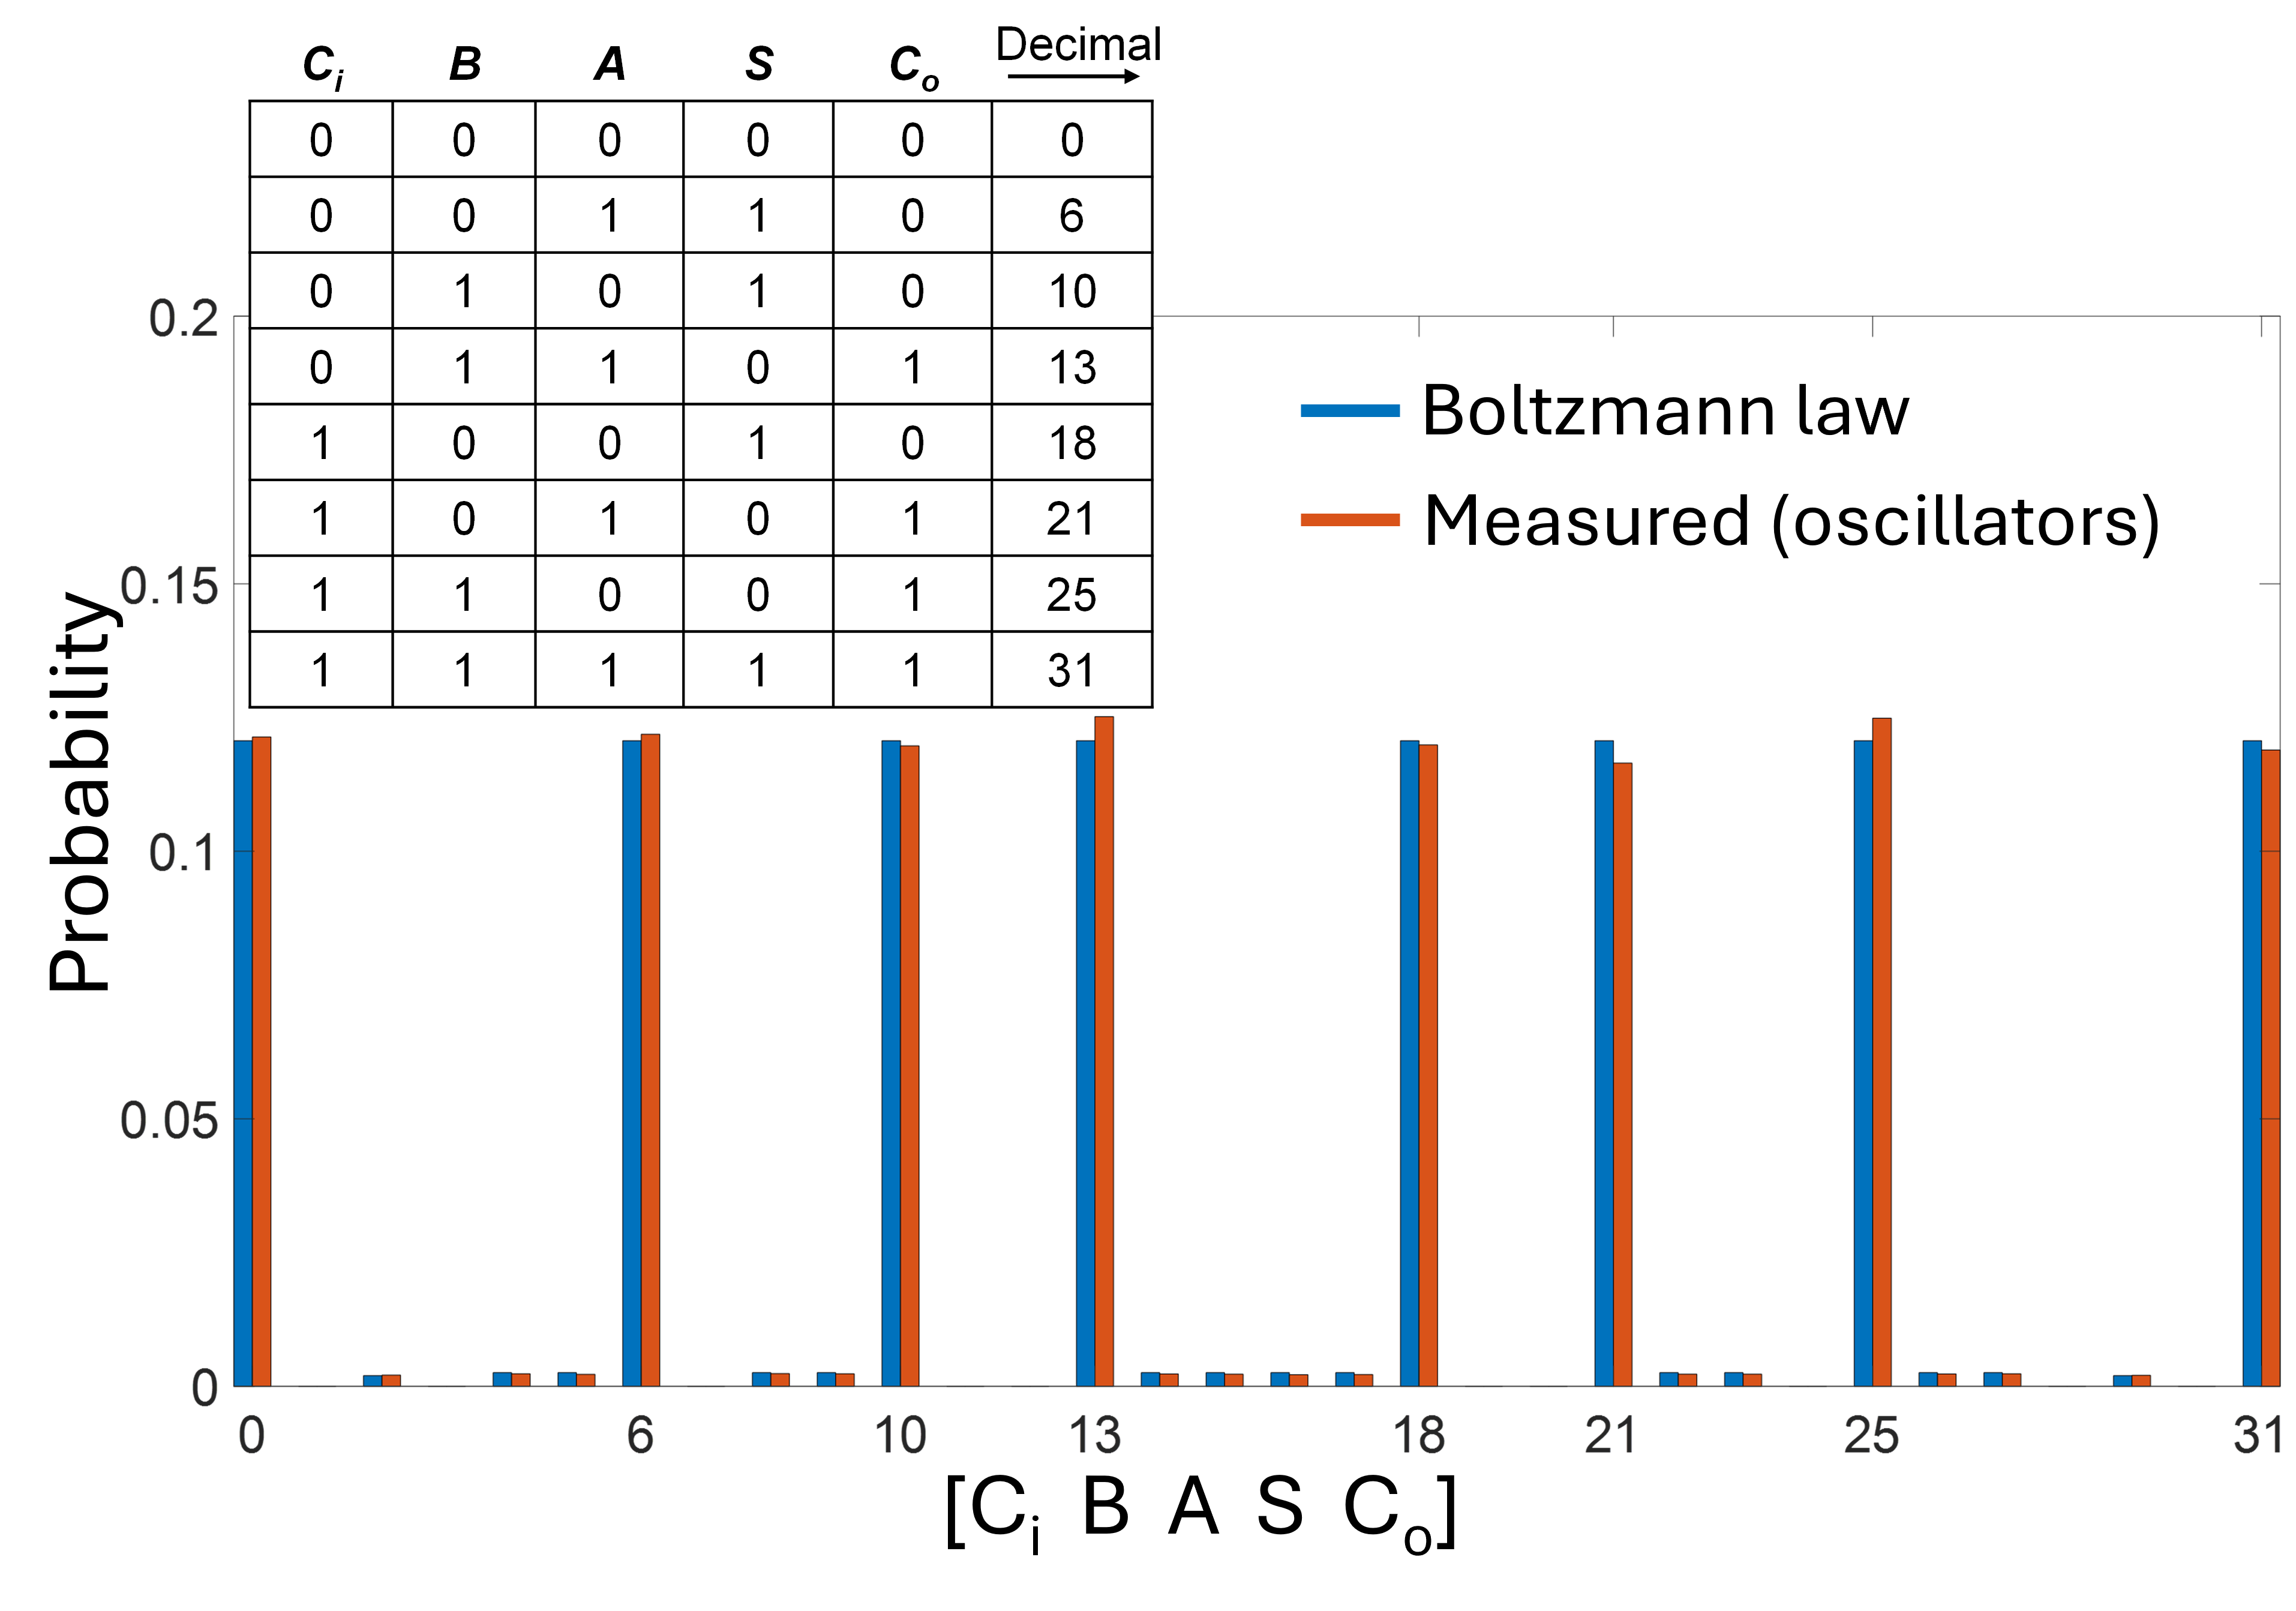
The chart compares two probability distributions: "Boltzmann law" (blue bars) and "Measured (oscillators)" (red bars) across discrete categories labeled [C_i B A S C_o]. The x-axis combines categorical labels and decimal values (0–31), while the y-axis represents probability (0–0.2). A table at the top maps categorical combinations to decimal values.
### Components/Axes
- **X-axis**:
- Labels: [C_i B A S C_o] (categorical) + decimal values (0, 6, 10, 13, 18, 21, 25, 31).
- Categories correspond to combinations of binary variables (C_i, B, A, S, C_o) listed in the table.
- **Y-axis**:
- Label: "Probability" (0–0.2 in increments of 0.05).
- **Legend**:
- Position: Right of the chart.
- Entries:
- Blue: "Boltzmann law"
- Red: "Measured (oscillators)"
- **Table**:
- Position: Top-left corner.
- Columns: C_i, B, A, S, C_o, Decimal.
- Rows: 8 combinations (e.g., 00000 → 0, 00110 → 6, etc.).
### Detailed Analysis
- **Boltzmann Law (Blue Bars)**:
- Values:
- 0: ~0.12
- 6: ~0.13
- 10: ~0.12
- 13: ~0.13
- 18: ~0.12
- 21: ~0.11
- 25: ~0.13
- 31: ~0.12
- Trend: Relatively flat with minor fluctuations (max ~0.13, min ~0.11).
- **Measured (Oscillators) (Red Bars)**:
- Values:
- 0: ~0.12
- 6: ~0.13
- 10: ~0.12
- 13: ~0.13
- 18: ~0.12
- 21: ~0.11
- 25: ~0.13
- 31: ~0.12
- Trend: Nearly identical to Boltzmann law, with slight deviations (e.g., 25: red bar slightly taller).
- **Table Data**:
- Decimal values map to binary combinations (e.g., 00000 → 0, 00110 → 6, 01010 → 10, etc.).
### Key Observations
1. **Alignment**: Both distributions show nearly identical probabilities across all categories, with red bars (measured) slightly exceeding blue bars (Boltzmann) at decimal 25 (~0.13 vs. ~0.12).
2. **Consistency**: Probabilities remain within a narrow range (0.11–0.13), suggesting minimal variability.
3. **Outliers**: No significant outliers; deviations are within measurement uncertainty.
### Interpretation
The chart demonstrates strong agreement between theoretical predictions (Boltzmann law) and experimental measurements (oscillators), with discrepancies likely attributable to experimental noise or minor model approximations. The flat trend across categories implies the system’s behavior is stable under the tested conditions. The slight divergence at decimal 25 warrants further investigation to determine if it reflects a systematic error or a genuine deviation from the law.