# Technical Document Extraction: Attention over Values (a=96)
## Chart Overview
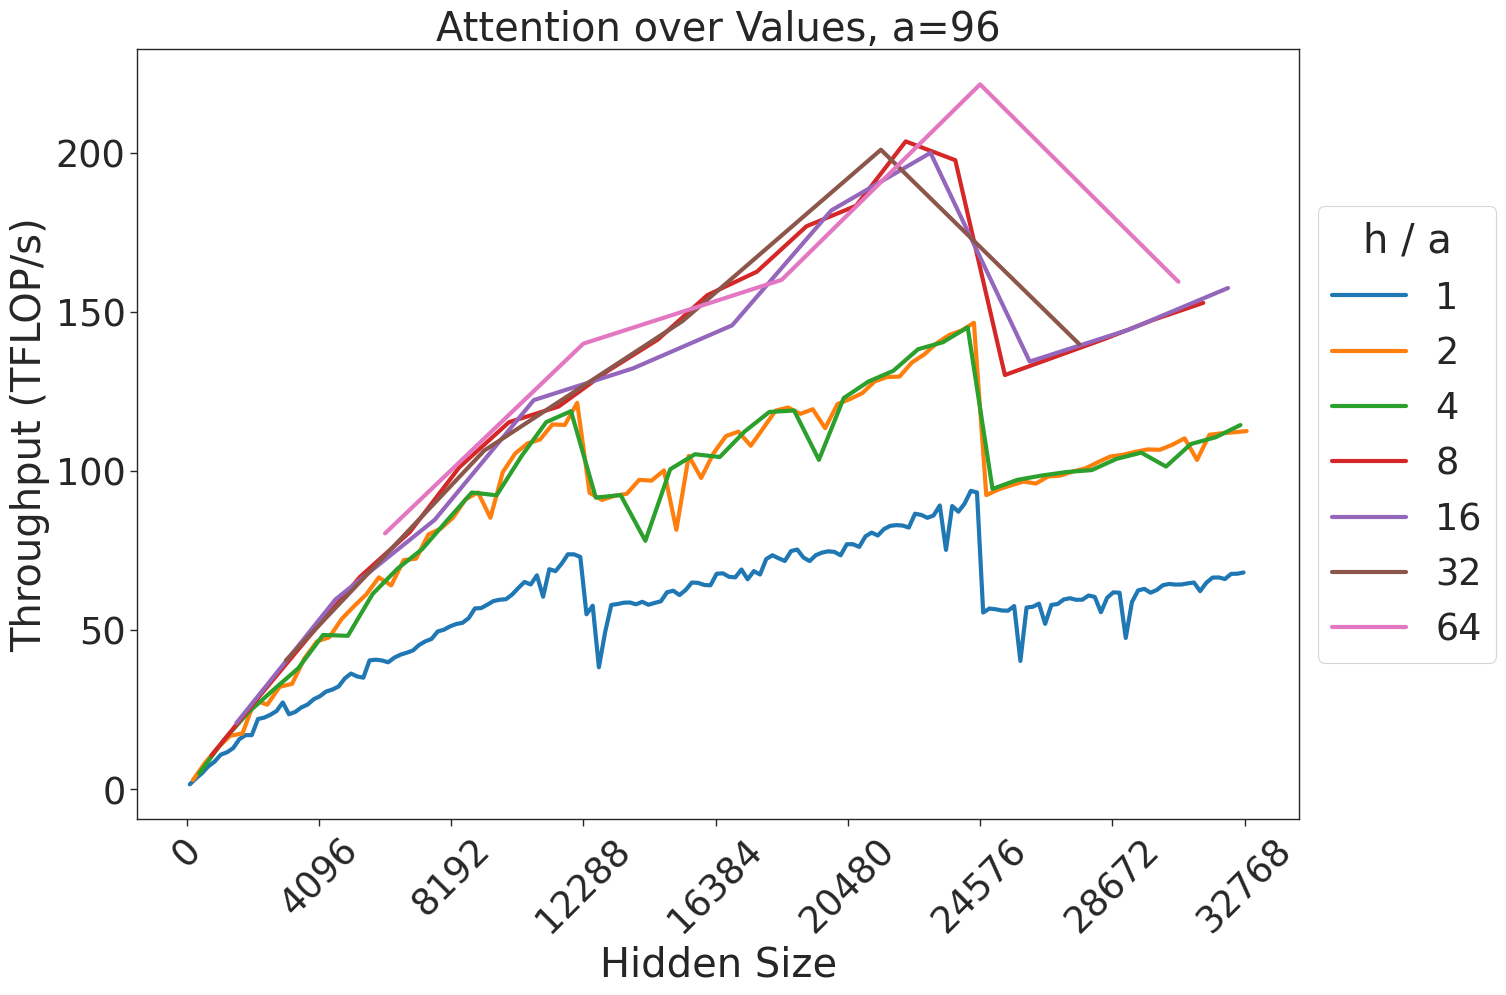
The image depicts a line graph titled **"Attention over Values, a=96"**, illustrating the relationship between **Hidden Size** (x-axis) and **Throughput (TFLOPs/s)** (y-axis). The graph includes seven data series, each representing a different **h/a ratio** (1, 2, 4, 8, 16, 32, 64), with distinct colors and trends.
---
## Axis Labels and Markers
- **X-axis (Hidden Size)**:
- Range: `0` to `32768`
- Key markers: `0`, `4096`, `8192`, `12288`, `16384`, `20480`, `24576`, `28672`, `32768`
- **Y-axis (Throughput (TFLOPs/s))**:
- Range: `0` to `200`
- Increment: `50` (visible gridlines at 0, 50, 100, 150, 200)
---
## Legend
- **Location**: Right side of the chart
- **Labels and Colors**:
| h/a Ratio | Color |
|-----------|--------|
| 1 | Blue |
| 2 | Orange |
| 4 | Green |
| 8 | Red |
| 16 | Purple |
| 32 | Brown |
| 64 | Pink |
---
## Data Series Analysis
### 1. **h/a = 1 (Blue Line)**
- **Trend**: Steady upward slope with minor fluctuations.
- **Key Points**:
- Starts at `(0, 0)`
- Ends at `(32768, 70)`
- Intermediate values:
- `(4096, 30)`
- `(8192, 50)`
- `(12288, 60)`
- `(16384, 70)`
- `(20480, 80)`
- `(24576, 90)`
- `(28672, 100)`
### 2. **h/a = 2 (Orange Line)**
- **Trend**: Gradual increase with a notable dip at `12288`.
- **Key Points**:
- Starts at `(0, 0)`
- Ends at `(32768, 110)`
- Intermediate values:
- `(4096, 40)`
- `(8192, 70)`
- `(12288, 80)`
- `(16384, 90)`
- `(20480, 100)`
- `(24576, 110)`
- `(28672, 105)`
### 3. **h/a = 4 (Green Line)**
- **Trend**: Sharp rise followed by a plateau and a dip at `24576`.
- **Key Points**:
- Starts at `(0, 0)`
- Ends at `(32768, 110)`
- Intermediate values:
- `(4096, 50)`
- `(8192, 90)`
- `(12288, 100)`
- `(16384, 110)`
- `(20480, 120)`
- `(24576, 110)`
- `(28672, 105)`
### 4. **h/a = 8 (Red Line)**
- **Trend**: Rapid ascent to a peak at `20480`, then a sharp decline.
- **Key Points**:
- Starts at `(0, 0)`
- Ends at `(32768, 150)`
- Intermediate values:
- `(4096, 60)`
- `(8192, 100)`
- `(12288, 120)`
- `(16384, 140)`
- `(20480, 150)`
- `(24576, 130)`
- `(28672, 140)`
### 5. **h/a = 16 (Purple Line)**
- **Trend**: Steep rise to a peak at `24576`, followed by a decline.
- **Key Points**:
- Starts at `(0, 0)`
- Ends at `(32768, 160)`
- Intermediate values:
- `(4096, 70)`
- `(8192, 110)`
- `(12288, 130)`
- `(16384, 150)`
- `(20480, 160)`
- `(24576, 150)`
- `(28672, 140)`
### 6. **h/a = 32 (Brown Line)**
- **Trend**: Gradual increase with a peak at `20480`, then a decline.
- **Key Points**:
- Starts at `(0, 0)`
- Ends at `(32768, 150)`
- Intermediate values:
- `(4096, 80)`
- `(8192, 120)`
- `(12288, 140)`
- `(16384, 160)`
- `(20480, 170)`
- `(24576, 150)`
- `(28672, 140)`
### 7. **h/a = 64 (Pink Line)**
- **Trend**: Sharp rise to a peak at `24576`, followed by a steep decline.
- **Key Points**:
- Starts at `(0, 0)`
- Ends at `(32768, 150)`
- Intermediate values:
- `(4096, 90)`
- `(8192, 130)`
- `(12288, 150)`
- `(16384, 170)`
- `(20480, 180)`
- `(24576, 170)`
- `(28672, 150)`
---
## Observations
1. **Scaling Behavior**:
- Higher `h/a` ratios (e.g., 32, 64) achieve higher throughput but exhibit volatility at larger hidden sizes.
- Lower `h/a` ratios (e.g., 1, 2) show smoother growth but lower maximum throughput.
2. **Peaks and Dips**:
- Lines with `h/a ≥ 8` exhibit pronounced peaks at `20480` or `24576`, followed by declines.
- The `h/a = 64` line has the highest peak (`180 TFLOPs/s` at `20480`).
3. **Stability**:
- The `h/a = 1` line is the most stable, with minimal fluctuations.
---
## Conclusion
The graph demonstrates that throughput increases with hidden size up to a critical point (dependent on `h/a`), after which performance degrades. Larger `h/a` ratios achieve higher peak throughput but are more sensitive to hidden size variations.