## Chart Type: Box Plot: Comparison of Goal Achievement
### Overview
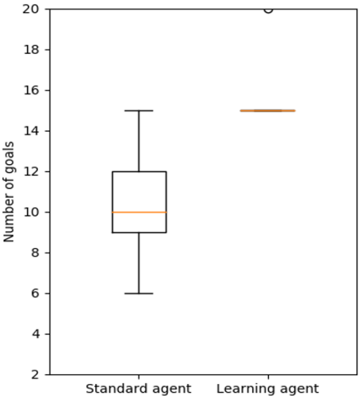
This image displays a box plot comparing the distribution of "Number of goals" achieved by two different types of agents: a "Standard agent" and a "Learning agent". The plot illustrates the median, quartiles, and range of goals for each agent, highlighting differences in their performance and consistency.
### Components/Axes
The chart is a 2D plot with a vertical Y-axis and a horizontal X-axis.
* **Y-axis Label**: "Number of goals"
* **Y-axis Scale**: Ranges from 2 to 20, with major tick marks at intervals of 2 (2, 4, 6, 8, 10, 12, 14, 16, 18, 20).
* **X-axis Labels**:
* "Standard agent" (positioned on the left)
* "Learning agent" (positioned on the right)
* **Legend**: There is no explicit legend. The X-axis labels serve to identify the two data series. The box plots themselves are rendered in white with black outlines, and the median line is orange. Outliers are shown as small black circles.
### Detailed Analysis
The chart presents two box plots, one for each agent type.
**1. Standard agent (Left Box Plot)**
* **Visual Trend**: This box plot shows a moderate spread in the data, indicating variability in the number of goals achieved. The box is relatively tall, and the whiskers extend both upwards and downwards.
* **Median (orange line)**: Approximately 10 goals.
* **First Quartile (Q1, bottom of the box)**: Approximately 9 goals.
* **Third Quartile (Q3, top of the box)**: Approximately 12 goals.
* **Interquartile Range (IQR)**: Approximately 3 goals (12 - 9).
* **Lower Whisker (bottom T-bar)**: Extends down to approximately 6 goals.
* **Upper Whisker (top T-bar)**: Extends up to approximately 15 goals.
* **Outliers**: No outliers are visible for the Standard agent.
**2. Learning agent (Right Box Plot)**
* **Visual Trend**: This box plot is extremely compressed, appearing almost as a single horizontal line for the box and whiskers, indicating very high consistency in performance. There is a single outlier point significantly above the main data distribution.
* **Median (orange line)**: Approximately 15 goals.
* **First Quartile (Q1, bottom of the box)**: Approximately 15 goals.
* **Third Quartile (Q3, top of the box)**: Approximately 15 goals.
* **Interquartile Range (IQR)**: Approximately 0 goals (15 - 15), suggesting that at least 50% of the data points are exactly at 15 goals.
* **Lower Whisker (bottom T-bar)**: Appears to be at approximately 15 goals, coinciding with the box.
* **Upper Whisker (top T-bar)**: Appears to be at approximately 15 goals, coinciding with the box.
* **Outliers**: One outlier is visible as a small black circle at approximately 20 goals.
### Key Observations
* The "Learning agent" generally achieves a higher number of goals than the "Standard agent". The median for the Learning agent is 15 goals, compared to 10 goals for the Standard agent.
* The "Learning agent" demonstrates significantly higher consistency in its performance. Its interquartile range (IQR) is effectively zero, and its whiskers are also at the same value as the box, indicating that the vast majority of its goal achievements are concentrated at 15 goals.
* The "Standard agent" shows more variability, with its central 50% of data (IQR) spanning from 9 to 12 goals, and its full non-outlier range from 6 to 15 goals.
* The "Learning agent" has an outlier performance at 20 goals, which is the highest single achievement observed across both agents.
### Interpretation
The data strongly suggests that the "Learning agent" is superior to the "Standard agent" in terms of goal achievement. Not only does the Learning agent achieve a higher median number of goals (15 vs. 10), but it also does so with remarkable consistency. The extremely narrow box and whiskers for the Learning agent indicate that in most trials or instances, it consistently achieves 15 goals. This high consistency is a significant advantage, implying reliability and predictability in its performance.
In contrast, the "Standard agent" exhibits a wider spread of performance, with its goal count varying more significantly. While its upper performance (up to 15 goals) can match the Learning agent's typical performance, its median is lower, and its performance can drop to as low as 6 goals.
The single outlier for the "Learning agent" at 20 goals suggests that, on rare occasions, it can achieve an even higher number of goals than its already consistent high performance. This could indicate a potential for even greater achievement under specific, perhaps optimal, conditions.
Overall, the "Learning agent" appears to be a more effective and reliable system for achieving goals, demonstrating both a higher typical performance and significantly less variability compared to the "Standard agent".