\n
## Box Plot: Number of Goals Comparison
### Overview
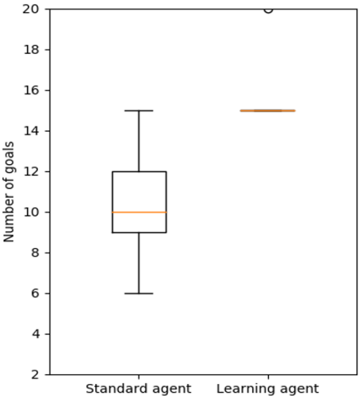
The image presents a box plot comparing the number of goals achieved by a "Standard agent" and a "Learning agent". The plot displays the distribution of goal counts for each agent, highlighting median, quartiles, and potential outliers.
### Components/Axes
* **X-axis:** Agent Type - labeled "Standard agent" and "Learning agent".
* **Y-axis:** Number of goals - scaled from 2 to 20, with increments of 2.
* **Box Plots:** Two box plots, one for each agent type. Each box plot includes:
* Box: Represents the interquartile range (IQR).
* Line within the box: Represents the median.
* Whiskers: Extend to the furthest data point within 1.5 times the IQR.
* Outliers: Data points beyond the whiskers, represented as individual points.
### Detailed Analysis
**Standard Agent:**
* The box plot for the Standard agent is positioned on the left side of the chart.
* The box extends from approximately 8 to 12.
* The median is around 10.5.
* The lower whisker extends down to approximately 6.
* The upper whisker extends up to approximately 15.
* There is one outlier at approximately 20.
**Learning Agent:**
* The box plot for the Learning agent is positioned on the right side of the chart.
* The box extends from approximately 14 to 16.
* The median is around 15.
* The lower whisker extends down to approximately 14.
* The upper whisker extends up to approximately 16.
* There are no outliers.
### Key Observations
* The Learning agent consistently achieves a higher number of goals compared to the Standard agent.
* The distribution of goal counts for the Learning agent is more concentrated, with a smaller IQR.
* The Standard agent has a wider range of goal counts and an outlier indicating a single instance of exceptionally high performance.
* The median number of goals for the Standard agent is approximately 10.5, while for the Learning agent it is approximately 15.
### Interpretation
The data suggests that the Learning agent is more effective at achieving goals than the Standard agent. The narrower distribution of goal counts for the Learning agent indicates more consistent performance. The outlier for the Standard agent suggests that, while it can occasionally achieve very high performance, its overall performance is less reliable. The difference in median values further supports the conclusion that the Learning agent outperforms the Standard agent. This could be due to the Learning agent's ability to adapt and improve its strategy over time, while the Standard agent operates with a fixed approach. The absence of outliers for the Learning agent suggests a more stable and predictable performance.