## Box Plot: Number of Goals Achieved by Two Agent Types
### Overview
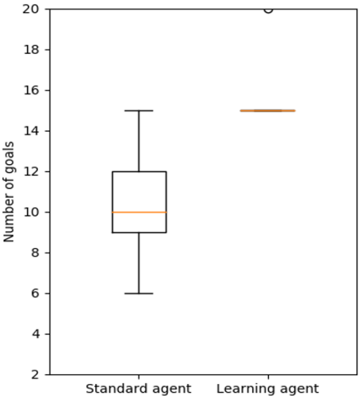
The image is a vertical box plot comparing the distribution of the "Number of goals" achieved by two distinct agent types: a "Standard agent" and a "Learning agent." The plot visually summarizes the central tendency, spread, and potential outliers for each group.
### Components/Axes
* **Chart Type:** Box Plot (Box-and-Whisker Plot).
* **Y-Axis:**
* **Title:** "Number of goals"
* **Scale:** Linear, ranging from 2 to 20.
* **Major Tick Marks:** At intervals of 2 (2, 4, 6, 8, 10, 12, 14, 16, 18, 20).
* **X-Axis:**
* **Categories:** Two discrete categories are labeled.
* **Left Category:** "Standard agent"
* **Right Category:** "Learning agent"
* **Legend:** Not present. The categories are directly labeled on the x-axis.
### Detailed Analysis
**1. Standard agent (Left Box Plot):**
* **Visual Trend:** The box is relatively tall, indicating a wide spread in the middle 50% of the data. The median line is positioned within the lower half of the box.
* **Data Points (Approximate):**
* **Minimum (Lower Whisker End):** ~6
* **First Quartile (Q1, Bottom of Box):** ~9
* **Median (Line Inside Box):** ~10
* **Third Quartile (Q3, Top of Box):** ~12
* **Maximum (Upper Whisker End):** ~15
* **Outliers:** None visible.
**2. Learning agent (Right Box Plot):**
* **Visual Trend:** The box is extremely compressed, appearing almost as a single horizontal line, indicating very low variability in the central 50% of the data. The median is significantly higher than that of the Standard agent. A single outlier is present at the top of the chart.
* **Data Points (Approximate):**
* **Minimum (Lower Whisker End):** ~15 (The lower whisker is very short or non-existent, suggesting the minimum is close to Q1).
* **First Quartile (Q1, Bottom of Box):** ~15
* **Median (Line Inside Box):** ~15
* **Third Quartile (Q3, Top of Box):** ~15
* **Maximum (Upper Whisker End):** ~15 (The upper whisker is very short).
* **Outlier:** One distinct outlier is plotted at the very top of the y-axis scale, at approximately **20**.
### Key Observations
1. **Performance Gap:** The Learning agent demonstrates a substantially higher median number of goals achieved (~15) compared to the Standard agent (~10).
2. **Consistency:** The Learning agent shows remarkable consistency in its core performance, as evidenced by the near-zero interquartile range (the compressed box). The Standard agent's performance is much more variable.
3. **Outlier:** The Learning agent has a single, high-performing outlier at 20 goals, which is the maximum value on the chart's scale. This suggests an exceptional run or condition.
4. **Spread Comparison:** The entire interquartile range of the Standard agent (9 to 12) lies below the median of the Learning agent (15). The Standard agent's maximum (15) only just reaches the Learning agent's median.
### Interpretation
The data strongly suggests that the "Learning agent" is superior to the "Standard agent" in the measured task of achieving goals. It not only achieves a higher typical number of goals but does so with extreme consistency, as shown by the tightly clustered central data. The Standard agent's performance is both lower on average and more unpredictable.
The presence of a single, high outlier for the Learning agent indicates that while its performance is highly reliable, there is potential for an exceptional outcome under specific circumstances. This outlier does not represent typical performance but may be of interest for understanding peak capability.
In summary, the chart provides clear visual evidence that the Learning agent's design or training leads to more effective and reliable goal achievement compared to the Standard agent baseline. The stark contrast in both central tendency and variability makes this a compelling comparison.