## Chart: Model Performance vs. Resources
### Overview
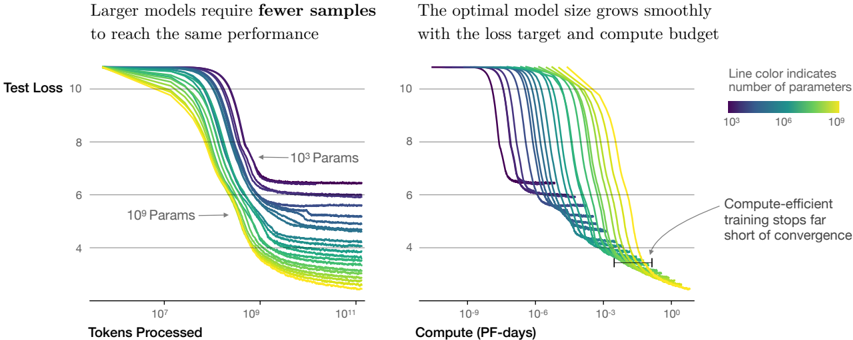
The image presents two line charts comparing the performance of machine learning models with varying sizes (number of parameters) against different resource metrics. The left chart shows "Test Loss" as a function of "Tokens Processed," while the right chart shows "Test Loss" as a function of "Compute (PF-days)." The line color indicates the number of parameters in the model, ranging from 10^3 (purple) to 10^9 (yellow).
### Components/Axes
**Left Chart:**
* **Title:** Larger models require fewer samples to reach the same performance
* **Y-axis:** Test Loss, with values ranging from 4 to 10.
* **X-axis:** Tokens Processed, with a logarithmic scale ranging from 10^1 to 10^11.
* **Annotations:** "10^3 Params" and "10^9 Params" with arrows pointing to the corresponding regions of the plot.
**Right Chart:**
* **Title:** The optimal model size grows smoothly with the loss target and compute budget
* **Y-axis:** Test Loss, with values ranging from 4 to 10.
* **X-axis:** Compute (PF-days), with a logarithmic scale ranging from 10^-9 to 10^0.
* **Annotation:** "Compute-efficient training stops far short of convergence" with an arrow pointing to a horizontal line segment on the right side of the chart.
**Legend:**
* **Position:** Top-right of the combined image.
* **Title:** Line color indicates number of parameters
* **Colors and Labels:**
* Purple: 10^3
* Teal: 10^6
* Yellow: 10^9
### Detailed Analysis
**Left Chart (Test Loss vs. Tokens Processed):**
* **General Trend:** All lines show a decreasing trend, indicating that test loss decreases as more tokens are processed.
* **Purple Lines (10^3 Parameters):** These lines start at a test loss of approximately 10 and decrease to a final test loss between 5 and 7. The lines flatten out around 10^9 tokens processed.
* **Teal Lines (10^6 Parameters):** These lines also start at a test loss of approximately 10 and decrease to a final test loss between 4 and 6. The lines flatten out around 10^8 tokens processed.
* **Yellow Lines (10^9 Parameters):** These lines start at a test loss of approximately 10 and decrease to a final test loss between 3 and 5. The lines flatten out around 10^7 tokens processed.
* **Observation:** Models with more parameters (yellow lines) reach lower test loss values with fewer tokens processed compared to models with fewer parameters (purple lines).
**Right Chart (Test Loss vs. Compute):**
* **General Trend:** All lines show a decreasing trend, indicating that test loss decreases as more compute is used.
* **Purple Lines (10^3 Parameters):** These lines start at a test loss of approximately 10 and decrease to a final test loss between 4 and 7. Some lines show plateaus at a test loss of around 6.
* **Teal Lines (10^6 Parameters):** These lines also start at a test loss of approximately 10 and decrease to a final test loss between 3 and 5.
* **Yellow Lines (10^9 Parameters):** These lines start at a test loss of approximately 10 and decrease to a final test loss between 3 and 4.
* **Horizontal Line Segment:** Located on the right side of the chart, near the bottom. It spans from approximately 10^-4 to 10^-2 on the x-axis (Compute).
* **Observation:** Models with more parameters (yellow lines) reach lower test loss values with less compute compared to models with fewer parameters (purple lines). The horizontal line segment indicates a point where compute-efficient training stops far short of convergence.
### Key Observations
* Larger models (more parameters) achieve lower test loss with fewer tokens processed and less compute.
* The relationship between model size, compute, and performance is smooth.
* Compute-efficient training may stop before full convergence.
### Interpretation
The charts demonstrate the trade-offs between model size, training data (tokens processed), compute resources, and model performance (test loss). The data suggests that increasing model size can lead to better performance with fewer training samples and less compute. However, the "Compute-efficient training stops far short of convergence" annotation indicates that there may be diminishing returns to increasing compute, and that training may be stopped early for efficiency reasons. The charts highlight the importance of considering model size and compute budget when training machine learning models. The trend suggests that larger models are more efficient in terms of data and compute requirements to achieve a certain level of performance.