## Diagram: Batch Processing Grid
### Overview
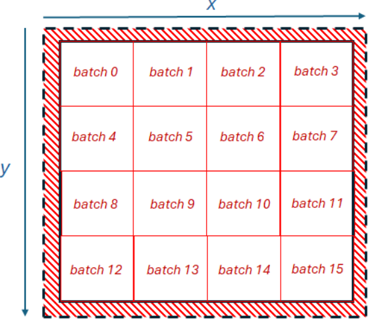
The image depicts a 2D grid representing a batch processing system. The grid is divided into 16 equal-sized cells, each labeled with a "batch" number from 0 to 15. The grid is enclosed by a border, with the x and y axes indicated. The border is hatched with red diagonal lines, and the grid lines are red.
### Components/Axes
* **X-axis:** Labeled "x" at the top.
* **Y-axis:** Labeled "y" on the left side.
* **Grid:** A 4x4 grid of cells.
* **Cells:** Each cell is labeled "batch [number]", where the number ranges from 0 to 15.
* **Border:** A hatched border surrounds the grid.
### Detailed Analysis
The grid is structured as follows:
* **Row 1:** batch 0, batch 1, batch 2, batch 3
* **Row 2:** batch 4, batch 5, batch 6, batch 7
* **Row 3:** batch 8, batch 9, batch 10, batch 11
* **Row 4:** batch 12, batch 13, batch 14, batch 15
The batches are numbered sequentially from left to right and top to bottom.
### Key Observations
The diagram illustrates a simple batch processing system where data is divided into 16 batches and processed in a grid-like manner. The x and y axes likely represent spatial dimensions or other relevant parameters for the data being processed.
### Interpretation
The diagram represents a parallel processing approach where a larger task is divided into smaller, independent batches that can be processed concurrently. The grid structure suggests a spatial or matrix-based organization of the data. The sequential numbering of the batches implies a specific order or dependency in the processing sequence. The diagram could be used to visualize data processing in image processing, scientific simulations, or other applications where data can be divided into batches and processed in parallel.