\n
## Diagram: Batch Processing Layout
### Overview
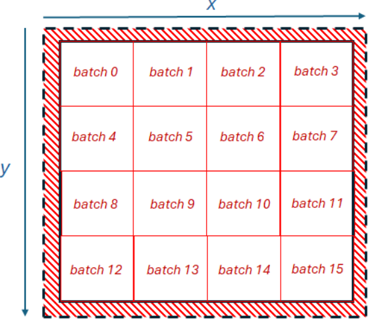
The image depicts a square region divided into a 4x4 grid, representing a batch processing layout. The grid is enclosed by a border with a diagonal hatch pattern. The dimensions of the overall region are labeled as 'x' (horizontal) and 'y' (vertical). Each cell within the grid is labeled with a "batch" number, ranging from 0 to 15.
### Components/Axes
* **Overall Region:** A square area representing the total processing space.
* **Dimensions:** Labeled 'x' and 'y', indicating the horizontal and vertical extent of the region. No units are provided.
* **Grid:** A 4x4 grid dividing the region into 16 equal cells.
* **Batches:** Each cell is labeled with a batch number: batch 0, batch 1, batch 2, batch 3, batch 4, batch 5, batch 6, batch 7, batch 8, batch 9, batch 10, batch 11, batch 12, batch 13, batch 14, batch 15.
* **Border:** A red border with a diagonal hatch pattern surrounds the grid.
### Detailed Analysis / Content Details
The diagram shows a systematic arrangement of batches within a defined space. The batches are numbered sequentially from left to right, top to bottom.
* **Batch 0:** Top-left cell.
* **Batch 1:** Top-second cell.
* **Batch 2:** Top-third cell.
* **Batch 3:** Top-right cell.
* **Batch 4:** Second row, first cell.
* **Batch 5:** Second row, second cell.
* **Batch 6:** Second row, third cell.
* **Batch 7:** Second row, fourth cell.
* **Batch 8:** Third row, first cell.
* **Batch 9:** Third row, second cell.
* **Batch 10:** Third row, third cell.
* **Batch 11:** Third row, fourth cell.
* **Batch 12:** Bottom row, first cell.
* **Batch 13:** Bottom row, second cell.
* **Batch 14:** Bottom row, third cell.
* **Batch 15:** Bottom row, fourth cell.
There is no numerical data beyond the batch numbers. The diagram is purely structural.
### Key Observations
The diagram illustrates a simple, organized layout for processing 16 independent batches. The sequential numbering suggests a potential processing order. The border may represent a physical boundary or a defined processing area.
### Interpretation
This diagram likely represents a conceptual model for parallel processing or batch operations. Each batch could represent a separate task, data segment, or unit of work. The grid structure suggests that these batches can be processed concurrently or in a defined sequence. The 'x' and 'y' dimensions indicate the spatial constraints or capacity of the processing system. The diagram doesn't provide information about processing time, resource allocation, or dependencies between batches, but it establishes a clear framework for organizing and managing batch-oriented tasks. The diagram is a visual representation of a data structure or a workflow, rather than a presentation of results or measurements.