## Diagram: Batch Grid Layout with Spatial Axes
### Overview
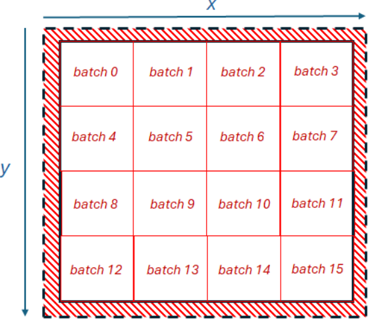
The image displays a technical diagram illustrating a 4x4 grid structure, likely representing a data partitioning, memory tiling, or batch processing layout. The grid is enclosed within a hatched border and is annotated with spatial axes (`x` and `y`) and sequential batch labels.
### Components/Axes
* **Axes:**
* **X-axis:** A horizontal arrow labeled `x` runs along the top edge of the diagram, pointing to the right.
* **Y-axis:** A vertical arrow labeled `y` runs along the left edge of the diagram, pointing downward.
* **Grid Structure:** A 4x4 grid of 16 rectangular cells.
* **Border:** The entire grid is surrounded by a thick, hatched border (diagonal red lines on a white background).
* **Labels:** Each cell contains a text label in red font, reading "batch" followed by a number.
### Detailed Analysis
The grid is organized into four rows and four columns. The batch numbers are assigned sequentially, increasing from left to right and top to bottom.
* **Row 1 (Top):** `batch 0`, `batch 1`, `batch 2`, `batch 3`
* **Row 2:** `batch 4`, `batch 5`, `batch 6`, `batch 7`
* **Row 3:** `batch 8`, `batch 9`, `batch 10`, `batch 11`
* **Row 4 (Bottom):** `batch 12`, `batch 13`, `batch 14`, `batch 15`
The `x` and `y` axes define a coordinate system where the origin (0,0) is implied to be at the top-left corner of the grid. The `x` coordinate increases to the right, and the `y` coordinate increases downward.
### Key Observations
1. **Sequential Ordering:** The batch numbering follows a strict row-major order (left-to-right, then top-to-bottom).
2. **Spatial Definition:** The axes explicitly define a 2D spatial context for the grid, suggesting the batches are mapped to physical or logical coordinates.
3. **Boundary Indication:** The prominent hatched border visually demarcates the grid as a distinct, bounded unit, possibly indicating a memory page, a processing tile, or a data block with defined margins or padding.
4. **Uniform Structure:** All cells are of equal size and shape, implying a uniform partitioning of space or resources.
### Interpretation
This diagram is a schematic representation of a **tiled or batched data structure within a 2D coordinate space**. It is commonly used in fields like computer graphics (texture tiling, memory layout for framebuffers), parallel computing (domain decomposition for processing), and data science (batching spatial data).
* **What it demonstrates:** It shows how a larger 2D space (defined by x and y) is subdivided into 16 equal, addressable units (batches 0-15). The sequential labeling provides a simple linear indexing scheme for these 2D tiles.
* **Relationships:** The `x` and `y` axes provide the global spatial reference. Each batch occupies a specific sub-region within this space. The hatched border suggests the entire tiled area is a single, managed entity, potentially with guard bands or alignment padding.
* **Notable Implications:** The row-major ordering is a critical detail for any algorithm accessing this data, as it defines the memory stride or traversal pattern. The lack of numerical scales on the axes indicates the diagram is conceptual, focusing on relative positioning and logical structure rather than absolute measurements. The design prioritizes clarity of the partitioning scheme and its spatial context.