## Diagram: Batch Processing Grid Layout
### Overview
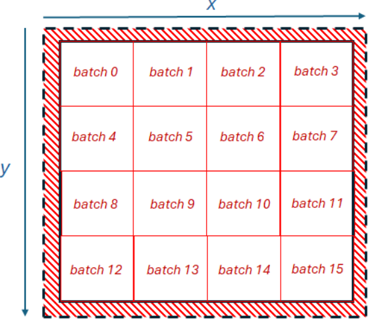
The image depicts a 4x4 grid structure labeled with sequential "batch" identifiers (batch 0 to batch 15). The grid is enclosed by a dashed red border, with directional arrows indicating axes labeled "x" (horizontal) and "y" (vertical). No numerical scales or legends are present.
### Components/Axes
- **Axes**:
- Horizontal axis labeled "x" (left to right).
- Vertical axis labeled "y" (top to bottom).
- **Grid Structure**:
- 4 columns (x-axis) and 4 rows (y-axis), forming 16 cells.
- Each cell contains a red text label: "batch [0-15]".
- **Border**: Dashed red lines form the outer boundary of the grid.
### Detailed Analysis
- **Batch Labeling**:
- Batches are numbered sequentially from **batch 0** (top-left) to **batch 15** (bottom-right).
- Labeling follows a row-major order:
- Row 1: batch 0, 1, 2, 3
- Row 2: batch 4, 5, 6, 7
- Row 3: batch 8, 9, 10, 11
- Row 4: batch 12, 13, 14, 15
- **Text Placement**:
- Labels are centered within each cell, using red text with a white background.
- No additional annotations, legends, or numerical values are present.
### Key Observations
1. The grid represents a **sequential batch organization** with no apparent prioritization or grouping.
2. The absence of numerical scales or legends suggests this is a **conceptual layout** rather than a data visualization.
3. The dashed red border emphasizes the grid’s boundaries but does not indicate any hierarchical or spatial relationships beyond the grid structure.
### Interpretation
This diagram likely illustrates a **parallel processing workflow** or **data partitioning strategy**, where batches are distributed across a grid for concurrent execution. The sequential labeling implies a linear workflow, but the grid structure could also suggest **parallelization across rows/columns** (e.g., row-wise or column-wise processing). The lack of numerical data or legends indicates this is a **topological representation** rather than a quantitative analysis.
**Notable Patterns**:
- Uniform cell size and consistent labeling suggest equal resource allocation or processing time per batch.
- No outliers or anomalies are present; the structure is strictly grid-based.
**Underlying Implications**:
- The diagram may represent a **theoretical model** for batch processing in distributed systems, where spatial arrangement (x/y axes) corresponds to computational resources (e.g., GPUs, servers).
- The absence of a legend or numerical data limits direct quantitative interpretation, but the grid’s symmetry implies balanced workload distribution.