# Technical Document Extraction: Machine Learning System Architecture
## 1. Document Overview
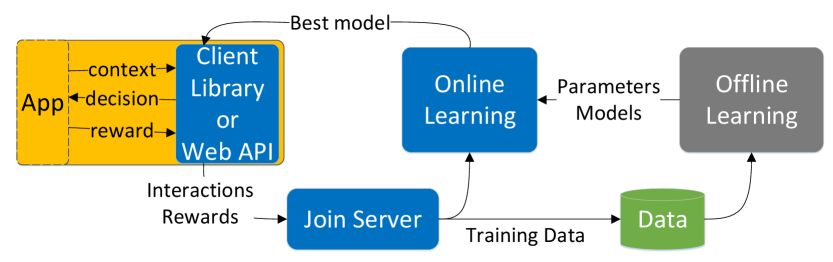
This image is a technical architectural diagram illustrating a Reinforcement Learning (RL) or Personalization loop. It details the flow of data between a client application, an online learning system, and an offline learning pipeline.
## 2. Component Isolation
### Region A: Client Interface (Left)
* **App (Yellow Box):** Represents the end-user application.
* **Client Library or Web API (Blue Box):** The interface layer that communicates directly with the App.
* **Internal Data Flow (App ↔ Client Library):**
* `context`: Arrow pointing from App to Client Library.
* `decision`: Arrow pointing from Client Library to App.
* `reward`: Arrow pointing from App to Client Library.
### Region B: Data Processing (Bottom Center)
* **Join Server (Blue Box):** Receives data from the Client Library.
* **Data (Green Cylinder):** A database or storage icon representing the persistence of training data.
### Region C: Learning Engines (Right/Top Center)
* **Online Learning (Blue Box):** A real-time learning component.
* **Offline Learning (Grey Box):** A batch processing or historical training component.
## 3. System Flow and Logic
The diagram describes a continuous feedback loop consisting of the following steps:
1. **Interaction Phase:**
* The **App** sends `context` to the **Client Library**.
* The **Client Library** returns a `decision` to the **App**.
* The **App** subsequently provides a `reward` based on the outcome of that decision.
2. **Data Aggregation:**
* The **Client Library** sends `Interactions` and `Rewards` to the **Join Server**.
* The **Join Server** processes these and sends `Training Data` to the **Data** storage.
3. **Learning Phase:**
* **Offline Learning:** Pulls data from the **Data** storage to train models. It outputs `Parameters` and `Models` to the **Online Learning** system.
* **Online Learning:** Receives real-time data from the **Join Server** and model updates from **Offline Learning**.
4. **Deployment Phase:**
* The **Online Learning** system identifies the `Best model` and pushes it back to the **Client Library or Web API** to inform future decisions.
## 4. Textual Transcriptions
| Label | Type | Context/Direction |
| :--- | :--- | :--- |
| **App** | Component | Primary user interface |
| **context** | Data Flow | App → Client Library |
| **decision** | Data Flow | Client Library → App |
| **reward** | Data Flow | App → Client Library |
| **Client Library or Web API** | Component | Integration layer |
| **Interactions Rewards** | Data Flow | Client Library → Join Server |
| **Join Server** | Component | Data ingestion and joining |
| **Training Data** | Data Flow | Join Server → Data Storage |
| **Data** | Component | Storage (Green Cylinder) |
| **Online Learning** | Component | Real-time model optimization |
| **Offline Learning** | Component | Batch model training |
| **Parameters Models** | Data Flow | Offline Learning → Online Learning |
| **Best model** | Data Flow | Online Learning → Client Library |
## 5. Visual/Spatial Grounding
* **Color Coding:**
* **Blue:** Active processing components (Client Library, Join Server, Online Learning).
* **Yellow:** User-facing application.
* **Grey:** Background/Batch processing (Offline Learning).
* **Green:** Data persistence.
* **Layout:** The diagram follows a circular flow. It starts at the far left (App), moves clockwise through the learning components on the right, and returns to the left via the "Best model" path. Data collection flows through the bottom center.