## Diagram: Piko Pipeline Architecture
### Overview
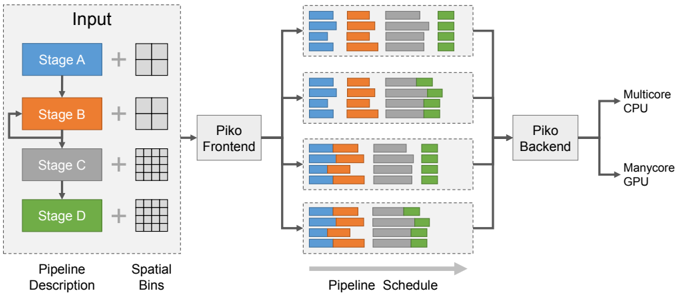
The image presents a diagram of the Piko pipeline architecture, illustrating the flow of data through different stages and its distribution across processing units. The diagram is divided into sections representing input, frontend processing, pipeline scheduling, backend processing, and output.
### Components/Axes
* **Input:** This section, enclosed in a dashed box, shows the pipeline description and spatial bins.
* **Pipeline Description:** Consists of four stages: Stage A (blue), Stage B (orange), Stage C (gray), and Stage D (green). Stage B has a feedback loop.
* **Spatial Bins:** Each stage is associated with a spatial bin representation, ranging from a 2x2 grid for Stages A and B to a 4x4 grid for Stages C and D.
* **Piko Frontend:** A rectangular block labeled "Piko Frontend" receives input from the "Input" section.
* **Pipeline Schedule:** This section shows four parallel pipelines, each represented by a dashed box. Each pipeline contains blocks of blue, orange, gray, and green, corresponding to the stages. The length of each block represents the time spent in each stage.
* **Piko Backend:** A rectangular block labeled "Piko Backend" receives input from the "Pipeline Schedule" section.
* **Output:** The output of the "Piko Backend" is split into two paths: "Multicore CPU" and "Manycore GPU".
* **Horizontal Axis:** Labeled "Pipeline Schedule" with an arrow indicating the direction of the schedule.
### Detailed Analysis
* **Input Section:**
* Stage A (blue) is at the top, followed by Stage B (orange), Stage C (gray), and Stage D (green).
* Stage B has a feedback loop, indicated by an arrow returning to the Stage B block.
* The spatial bins associated with each stage increase in granularity from top to bottom.
* **Pipeline Schedule Section:**
* Four parallel pipelines are shown.
* Each pipeline consists of blocks representing the stages. The length of the blocks varies across the pipelines, indicating different processing times for each stage.
* In the first pipeline, the blocks are arranged as follows: blue, orange, gray, green.
* In the second pipeline, the blocks are arranged as follows: blue, orange, gray, green.
* In the third pipeline, the blocks are arranged as follows: blue, orange, gray, green.
* In the fourth pipeline, the blocks are arranged as follows: blue, orange, gray, green.
* **Output Section:**
* The output of the "Piko Backend" is split into two paths: "Multicore CPU" and "Manycore GPU".
### Key Observations
* The diagram illustrates a pipeline architecture with four stages.
* The spatial bins increase in granularity as the pipeline progresses.
* The pipeline schedule shows four parallel pipelines with varying processing times for each stage.
* The output is distributed across multicore CPU and manycore GPU.
### Interpretation
The diagram represents a data processing pipeline where input data undergoes a series of transformations in four stages (A, B, C, and D). The "Piko Frontend" likely handles initial processing and distribution of the data. The "Pipeline Schedule" section suggests that the pipeline can be executed in parallel, potentially to improve throughput. The "Piko Backend" likely performs final processing and distributes the workload across different processing units (multicore CPU and manycore GPU) based on the nature of the task. The feedback loop in Stage B suggests an iterative process within that stage. The increasing granularity of spatial bins may indicate a refinement or focusing of the data as it progresses through the pipeline.