TECHNICAL ASSET FINGERPRINT
136d71e171e426cbe350a931
Click to view fullscreen
Press ESC or click to close
FOUND IN PAPERS
EXPERT: gemini-2.5-flash-free VERSION 1
RUNTIME: google-free/gemini-2.5-flash
INTEL_VERIFIED
## Diagram: Piko System Architecture and Pipeline Scheduling
### Overview
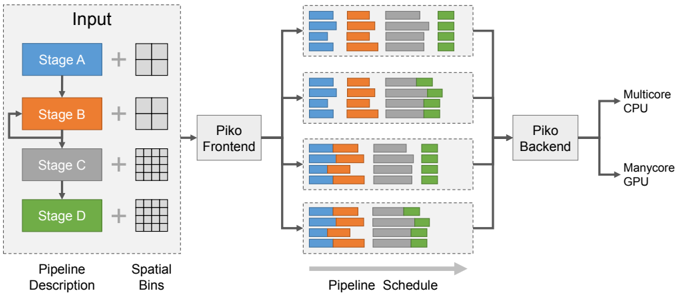
This image presents a system diagram illustrating the Piko system, which processes a pipeline description and spatial binning information to generate a pipeline schedule, ultimately targeting different hardware architectures. The diagram is divided into three main conceptual sections: Input, Piko Frontend and Pipeline Schedule, and Piko Backend with its outputs. It shows how a sequential pipeline can be transformed into various parallel schedules.
### Components/Axes
**Left Section: Input**
* **Bounding Box Label**: "Input" (top-center of the dashed box)
* **Pipeline Description**: A vertical sequence of four rectangular blocks, representing stages of a pipeline:
* **Stage A**: Blue rectangle, top.
* **Stage B**: Orange rectangle, second from top. An arrow indicates a feedback loop from the output of Stage C back to the input of Stage B.
* **Stage C**: Grey rectangle, third from top.
* **Stage D**: Green rectangle, bottom.
* **Flow**: Downward arrows connect Stage A to B, B to C, and C to D, indicating sequential execution.
* **Spatial Bins**: To the right of each pipeline stage, a grid icon represents spatial binning:
* **Stage A**: A 2x2 grid (4 cells).
* **Stage B**: A 2x2 grid (4 cells).
* **Stage C**: A 4x4 grid (16 cells).
* **Stage D**: A 4x4 grid (16 cells).
* **Labels below Input section**:
* "Pipeline Description" (bottom-left)
* "Spatial Bins" (bottom-right)
**Middle Section: Piko Frontend and Pipeline Schedule**
* **Piko Frontend**: A grey rectangular block labeled "Piko Frontend", positioned centrally between the Input and Pipeline Schedule sections. An arrow points from the "Input" dashed box to "Piko Frontend".
* **Pipeline Schedule**: Four distinct dashed bounding boxes, arranged vertically, each containing a set of horizontal stacked bar charts. Arrows point from "Piko Frontend" to each of these four schedule boxes, indicating parallel processing or different scheduling options.
* **Axis/Label**: A horizontal grey arrow below these four boxes is labeled "Pipeline Schedule", indicating a timeline or progression.
* **Bar Chart Structure (within each schedule box)**: Each box contains 3 rows of horizontal stacked bars. Each row appears to represent a separate task or thread. Each bar is composed of four colored segments, corresponding to the pipeline stages:
* Blue segment: Stage A
* Orange segment: Stage B
* Grey segment: Stage C
* Green segment: Stage D
**Right Section: Piko Backend and Outputs**
* **Piko Backend**: A grey rectangular block labeled "Piko Backend", positioned centrally to the right of the Pipeline Schedule section. Arrows point from each of the four "Pipeline Schedule" boxes to "Piko Backend".
* **Outputs**: Two output labels with arrows originating from "Piko Backend":
* "Multicore CPU" (top-right)
* "Manycore GPU" (bottom-right)
### Detailed Analysis
**Input Section:**
The input defines a four-stage pipeline (A, B, C, D) with a feedback loop from Stage C to Stage B. Stages A and B operate on a coarser 2x2 spatial binning, while Stages C and D operate on a finer 4x4 spatial binning. This suggests a hierarchical or multi-resolution processing approach.
**Pipeline Schedule Section (Detailed Bar Analysis):**
Each of the four "Pipeline Schedule" blocks shows three horizontal bars, representing three parallel execution units or tasks. The length of each colored segment within a bar indicates the relative duration or workload of that stage for that specific task.
1. **Top Pipeline Schedule Block**:
* **Trend**: All three bars show a predominantly sequential execution of stages A, B, C, and D from left to right.
* **Details**:
* **Bar 1 (Top)**: Blue (A) is short, followed by Orange (B) which is slightly longer, then Grey (C) which is the longest, and Green (D) which is medium length.
* **Bar 2 (Middle)**: Similar to Bar 1, with short Blue (A), slightly longer Orange (B), longest Grey (C), and medium Green (D).
* **Bar 3 (Bottom)**: Similar to Bar 1 and 2, with short Blue (A), slightly longer Orange (B), longest Grey (C), and medium Green (D).
* **Observation**: This schedule appears to be a basic, mostly sequential execution across three parallel tasks, with Stage C consuming the most time.
2. **Second Pipeline Schedule Block (from top)**:
* **Trend**: Similar to the top block, showing sequential execution, but with minor variations in segment lengths and possibly slightly different start times for stages across the tasks.
* **Details**:
* **Bar 1 (Top)**: Blue (A) is short, Orange (B) is slightly longer, Grey (C) is the longest, Green (D) is medium.
* **Bar 2 (Middle)**: Blue (A) is short, Orange (B) is slightly longer, Grey (C) is the longest, Green (D) is medium.
* **Bar 3 (Bottom)**: Blue (A) is short, Orange (B) is slightly longer, Grey (C) is the longest, Green (D) is medium.
* **Observation**: This schedule is very similar to the first, suggesting a baseline or slightly optimized sequential execution.
3. **Third Pipeline Schedule Block (from top)**:
* **Trend**: This block shows significant overlap and parallelization, particularly between Stage A and B, and Stage B and C. The stages are no longer strictly sequential within a single bar.
* **Details**:
* **Bar 1 (Top)**: Blue (A) starts, then Orange (B) starts *before* A finishes, overlapping significantly. Grey (C) starts *before* B finishes, also overlapping. Green (D) starts *before* C finishes, with some overlap.
* **Bar 2 (Middle)**: Similar overlapping pattern as Bar 1, with A, B, C, D segments showing concurrent execution.
* **Bar 3 (Bottom)**: Similar overlapping pattern as Bar 1 and 2.
* **Observation**: This schedule demonstrates pipelining or fine-grained parallelization, where stages begin processing before preceding stages are fully complete, leading to a shorter overall execution time for each task.
4. **Bottom Pipeline Schedule Block**:
* **Trend**: This block continues the trend of the third block, showing extensive overlap and parallelization among stages A, B, C, and D.
* **Details**:
* **Bar 1 (Top)**: Strong overlap between A and B, B and C, and C and D. The total length of the bar (overall task duration) appears shorter than in the first two blocks.
* **Bar 2 (Middle)**: Similar extensive overlapping pattern.
* **Bar 3 (Bottom)**: Similar extensive overlapping pattern.
* **Observation**: This schedule represents a highly optimized, parallel execution, likely leveraging the maximum possible concurrency between pipeline stages.
### Key Observations
* The system takes a "Pipeline Description" (sequential stages with a feedback loop) and "Spatial Bins" (different granularities for stages) as input.
* The "Piko Frontend" transforms this input into various "Pipeline Schedules".
* The "Pipeline Schedule" section demonstrates a progression from mostly sequential execution (top two blocks) to highly parallelized and pipelined execution (bottom two blocks).
* Each schedule block shows three parallel tasks, suggesting the system can schedule multiple instances of the pipeline concurrently.
* The "Piko Backend" takes these schedules and targets them for execution on "Multicore CPU" or "Manycore GPU", implying hardware-specific optimization.
* The feedback loop from Stage C to Stage B in the input pipeline description is a notable feature, suggesting iterative processing or refinement.
* The change in spatial binning from 2x2 to 4x4 between Stage B and C indicates a potential change in data resolution or processing granularity within the pipeline.
### Interpretation
The Piko system appears to be a compiler or runtime system designed to optimize the execution of image processing or data-parallel pipelines.
1. **Input Definition**: The "Input" section defines a computational graph (the pipeline stages) and associated data characteristics (spatial bins). The feedback loop (C to B) suggests an iterative algorithm, possibly for refinement or convergence. The varying spatial bins imply that different stages might operate on different resolutions or data partitions, which is common in image processing (e.g., downsampling, processing, then upsampling).
2. **Frontend's Role**: The "Piko Frontend" likely analyzes this pipeline description and spatial information to identify potential parallelism and dependencies. It then generates different possible execution schedules. The four "Pipeline Schedule" blocks represent different strategies or levels of optimization that the frontend can produce. The progression from sequential to highly parallel schedules demonstrates the frontend's ability to explore the scheduling space.
3. **Scheduling Strategies**:
* The top two schedule blocks show a more conservative, sequential execution, possibly suitable for simpler hardware or when dependencies are strict.
* The bottom two schedule blocks, with their significant overlaps, illustrate aggressive pipelining and parallelization. This suggests that the Piko system can break down stages into smaller, concurrently executable units, or that it can overlap the execution of different stages across different data elements (e.g., processing Stage A for data element 2 while Stage B processes data element 1). This is crucial for maximizing throughput on modern parallel hardware.
4. **Backend's Role and Hardware Targeting**: The "Piko Backend" takes these optimized schedules and translates them into executable code or instructions for specific hardware. The outputs "Multicore CPU" and "Manycore GPU" highlight Piko's capability to target diverse parallel architectures, implying that the backend performs architecture-specific code generation and optimization (e.g., using OpenMP for CPU, CUDA/OpenCL for GPU). The choice of schedule might depend on the target hardware's capabilities and the desired performance characteristics.
In essence, Piko automates the complex task of transforming a high-level, potentially sequential pipeline description into highly optimized, parallel execution schedules tailored for different parallel computing platforms, thereby abstracting away much of the low-level parallel programming effort. The visual representation of varying schedules effectively communicates the system's ability to exploit different levels of parallelism.
DECODING INTELLIGENCE...