\n
## Diagram: Piko Pipeline Architecture
### Overview
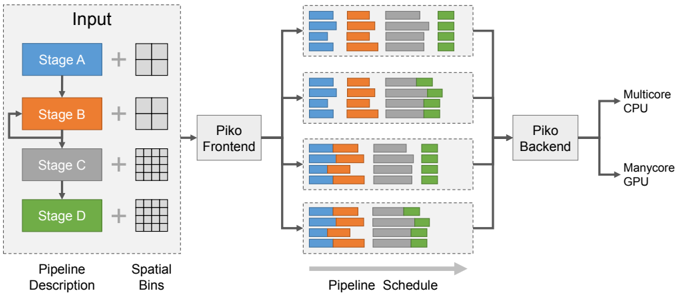
The image depicts the architecture of the Piko pipeline, illustrating the flow of data from an input stage through a frontend and backend processing system, ultimately targeting a multicore CPU and a manycore GPU. The diagram is segmented into three main areas: "Pipeline Description" (input stages), "Piko Frontend", "Piko Backend", and the final hardware targets. The "Pipeline Schedule" section visualizes the execution order of stages on the backend.
### Components/Axes
The diagram consists of the following components:
* **Input:** Stages A, B, C, and D, represented by colored rectangles (blue, orange, gray, and green respectively). Each stage is connected to a "Spatial Bins" representation, which appears as a grid.
* **Piko Frontend:** A central processing unit that receives input from all four stages.
* **Piko Backend:** A processing unit that receives input from the Piko Frontend and distributes it to the target hardware.
* **Hardware Targets:** A multicore CPU and a manycore GPU.
* **Pipeline Schedule:** A series of horizontal bars representing the execution schedule of stages on the Piko Backend. Each bar is divided into colored segments corresponding to the input stages (blue, orange, gray, and green).
* **Labels:** "Input", "Stage A", "Stage B", "Stage C", "Stage D", "Spatial Bins", "Piko Frontend", "Piko Backend", "Multicore CPU", "Manycore GPU", "Pipeline Description", "Pipeline Schedule".
* **Arrows:** Indicate the flow of data between components.
### Detailed Analysis or Content Details
The "Pipeline Description" section shows four stages (A-D) each connected to a grid representing "Spatial Bins". The stages are colored as follows:
* Stage A: Blue
* Stage B: Orange
* Stage C: Gray
* Stage D: Green
The "Piko Frontend" receives input from all four stages. The "Piko Backend" then schedules these stages for execution. The "Pipeline Schedule" shows four rows, each representing a time slot or execution cycle. Each row contains segments of the four colors (blue, orange, gray, and green), indicating which stages are being executed in that time slot.
Let's analyze the "Pipeline Schedule" row by row:
* **Row 1:** Orange, Gray, Green, Blue.
* **Row 2:** Orange, Gray, Green, Blue.
* **Row 3:** Orange, Gray, Green, Blue.
* **Row 4:** Orange, Gray, Green, Blue.
The schedule appears to repeat the same pattern across all four rows. The order of execution is consistently Orange, Gray, Green, then Blue.
### Key Observations
* The pipeline consists of four distinct stages.
* The "Spatial Bins" representation suggests a spatial partitioning of the data.
* The "Pipeline Schedule" indicates a fixed execution order for the stages.
* The backend distributes the workload to both a CPU and a GPU.
* The schedule repeats the same pattern across all four time slots, suggesting a periodic execution pattern.
### Interpretation
The diagram illustrates a pipelined architecture where data flows through a series of stages. The Piko Frontend likely handles the initial processing and distribution of data, while the Piko Backend manages the scheduling and execution of stages on the target hardware. The consistent execution order in the "Pipeline Schedule" suggests that the pipeline is optimized for a specific type of workload. The use of both a CPU and a GPU indicates a heterogeneous computing environment, where different stages are executed on the most appropriate hardware. The "Spatial Bins" representation suggests that the data is partitioned spatially, potentially for parallel processing. The diagram highlights a system designed for efficient parallel execution of a four-stage pipeline, leveraging both CPU and GPU resources. The repeating schedule suggests a steady-state operation, indicating the pipeline is continuously processing data.