## System Architecture Diagram: Parallel Processing Pipeline
### Overview
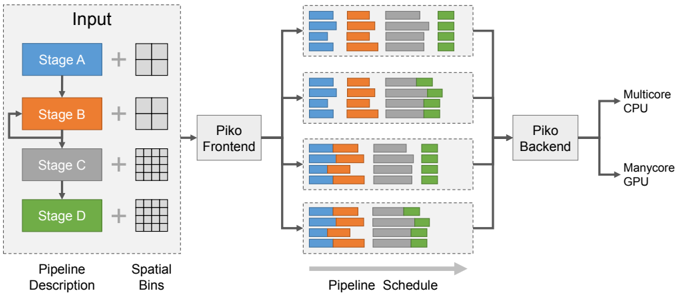
The image is a technical system architecture diagram illustrating a multi-stage data processing pipeline. It depicts how an input, described by a pipeline and spatial bins, is processed through a frontend, distributed across parallel execution units, and finally handled by a backend for execution on heterogeneous hardware (CPU and GPU). The flow is from left to right.
### Components/Axes
The diagram is organized into four main regions from left to right:
1. **Input Region (Left):**
* A dashed box labeled **"Input"**.
* Contains a vertical sequence of four colored blocks representing stages:
* **Stage A** (Blue block)
* **Stage B** (Orange block)
* **Stage C** (Gray block)
* **Stage D** (Green block)
* Each stage block is connected to a plus sign (`+`) and a grid icon.
* Below the sequence, two labels define the components:
* **"Pipeline Description"** (positioned under the stage blocks).
* **"Spatial Bins"** (positioned under the grid icons).
2. **Frontend & Scheduling Region (Center-Left):**
* A single box labeled **"Piko Frontend"**.
* It receives input from the "Input" region.
* It outputs to four parallel horizontal pipelines.
3. **Parallel Pipeline Region (Center):**
* Four identical horizontal pipelines stacked vertically.
* Each pipeline is a dashed box containing a sequence of colored blocks. The color order in each pipeline is consistent: **Blue, Orange, Gray, Green**.
* The blocks within each pipeline vary in width and arrangement, suggesting different task distributions or workloads.
* A large gray arrow below this region points to the right and is labeled **"Pipeline Schedule"**.
4. **Backend & Output Region (Right):**
* A box labeled **"Piko Backend"** that collects output from all four parallel pipelines.
* The backend connects to two final output hardware targets:
* **"Multicore CPU"**
* **"Manycore GPU"**
### Detailed Analysis
* **Data Flow:** The flow is strictly left-to-right: `Input -> Piko Frontend -> [4 Parallel Pipelines] -> Piko Backend -> Hardware Targets (CPU/GPU)`.
* **Color Coding & Legend:** There is no separate legend box. The color coding is intrinsic to the diagram:
* **Blue** = Stage A
* **Orange** = Stage B
* **Gray** = Stage C
* **Green** = Stage D
* This color scheme is maintained from the initial "Input" stage blocks through to the task blocks within each of the four parallel pipelines.
* **Spatial Arrangement:**
* The "Input" region is on the far left.
* The "Piko Frontend" is immediately to its right.
* The four parallel pipelines occupy the central area, stacked vertically.
* The "Piko Backend" is to the right of the pipelines.
* The hardware targets ("Multicore CPU", "Manycore GPU") are on the far right.
* **Component Relationships:** The diagram shows a one-to-many-to-one relationship. A single input description is fanned out by the frontend into multiple parallel execution schedules (the four pipelines), which are then collected and managed by a single backend for final execution on available hardware.
### Key Observations
1. **Parallelism:** The core concept is parallel execution. The single input pipeline is scheduled into four distinct parallel execution paths.
2. **Heterogeneous Execution:** The system is designed to target both multicore CPUs and manycore GPUs, indicating a focus on performance across different hardware architectures.
3. **Abstraction Layers:** The diagram shows clear abstraction layers: a high-level "Pipeline Description" and "Spatial Bins" are translated by the "Piko Frontend" into concrete, parallel "Pipeline Schedule[s]".
4. **Task Granularity:** The varying widths of the colored blocks within the parallel pipelines suggest that the workload (tasks from Stages A-D) is partitioned into chunks of different sizes for parallel execution.
### Interpretation
This diagram represents a **compiler or runtime system for parallel computing**, likely named "Piko". Its purpose is to take a high-level description of a computational pipeline (Stages A-D) and spatial data partitioning (Spatial Bins), and automatically generate an optimized schedule for executing that pipeline in parallel.
The system's intelligence lies in the **"Piko Frontend"**, which performs the crucial task of **mapping a logical pipeline onto physical parallel resources**. The four parallel pipelines in the center represent the scheduled work, showing how the original stages are broken down and distributed. The **"Piko Backend"** then acts as the executor, managing the actual computation on the target hardware (CPU/GPU).
The key takeaway is the automation of parallelization. A developer defines *what* to compute (the pipeline) and *how* the data is structured (spatial bins), and the Piko system determines *how* to compute it efficiently in parallel across available hardware. This is a common pattern in high-performance computing (HPC), data processing frameworks, and graphics rendering pipelines.