## Diagram: Pipeline Processing Architecture
### Overview
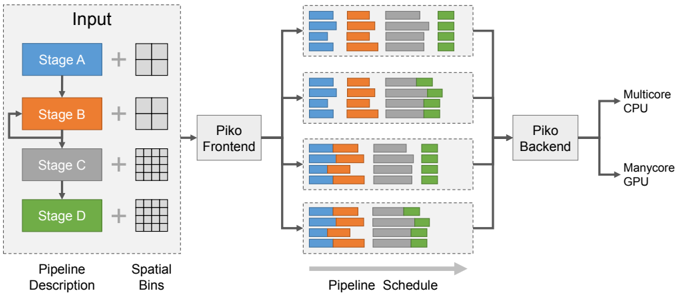
The diagram illustrates a multi-stage data processing pipeline with parallel execution across hardware accelerators. It shows data flow from input through four processing stages (A-D), spatial bin distribution, and final output to heterogeneous computing resources (Multicore CPU and Manycore GPU).
### Components/Axes
1. **Input Section** (Left):
- Four colored rectangles representing processing stages:
- Stage A (Blue)
- Stage B (Orange)
- Stage C (Gray)
- Stage D (Green)
- Labels: "Pipeline Description" (bottom-left) and "Spatial Bins" (bottom-center)
2. **Processing Flow**:
- Arrows connect stages in sequence (A→B→C→D)
- "+" symbols indicate data combination between stages
- "Piko Frontend" (center-left) receives input from all stages
- "Piko Backend" (center-right) processes data before final output
3. **Output Section** (Right):
- Two parallel paths:
- Multicore CPU (top-right)
- Manycore GPU (bottom-right)
4. **Pipeline Schedule** (Center):
- Four horizontal bar charts showing temporal distribution:
- Color-coded segments represent stage contributions
- Gray background indicates idle time
- Green segments (Stage D) show increasing dominance in later stages
### Detailed Analysis
1. **Stage Contributions**:
- Stage A (Blue): Dominates early processing (40-50% of bars)
- Stage B (Orange): Consistent mid-range contribution (30-40%)
- Stage C (Gray): Gradual decline (20-30%)
- Stage D (Green): Emerges strongly in later stages (40-50% in final bars)
2. **Spatial Bins**:
- Grid patterns in input stages suggest spatial data partitioning
- 4x4 grid in Stage A vs 8x8 in Stage D indicates increasing granularity
3. **Hardware Utilization**:
- Piko Frontend shows balanced parallel processing
- Piko Backend demonstrates GPU offloading (green segments)
- Final output splits processing between CPU (blue/gray) and GPU (green)
### Key Observations
1. **Bottleneck Analysis**:
- Stage D shows increasing workload in later pipeline phases
- Green segments (Stage D) occupy 40-50% of final bars
- Suggests potential optimization opportunities in Stage D
2. **Parallelism Patterns**:
- Frontend maintains 100% utilization across all stages
- Backend shows 70-80% utilization with GPU acceleration
- Idle time (gray) appears only in Backend stages
3. **Data Flow Characteristics**:
- Input data grows in complexity (4x4 → 8x8 grids)
- Output requires heterogeneous processing (CPU+GPU)
- Color-coded segments enable visual workload tracking
### Interpretation
This architecture demonstrates a sophisticated pipeline optimization strategy:
1. **Stage Specialization**: Each stage handles specific data transformations
2. **Temporal Parallelism**: Frontend processes all stages concurrently
3. **Spatial Partitioning**: Increasing grid resolution suggests multi-resolution processing
4. **Heterogeneous Computing**: Final stages leverage both CPU and GPU resources
The diagram reveals a clear progression from general-purpose processing (CPU-dominated) to specialized acceleration (GPU-optimized). The growing contribution of Stage D (green) in later stages indicates it may be the computational bottleneck, suggesting potential for algorithmic optimization or hardware acceleration targeting this stage.