## Line Charts: Attention Weight Analysis for Qwen2.5-Math-7B
### Overview
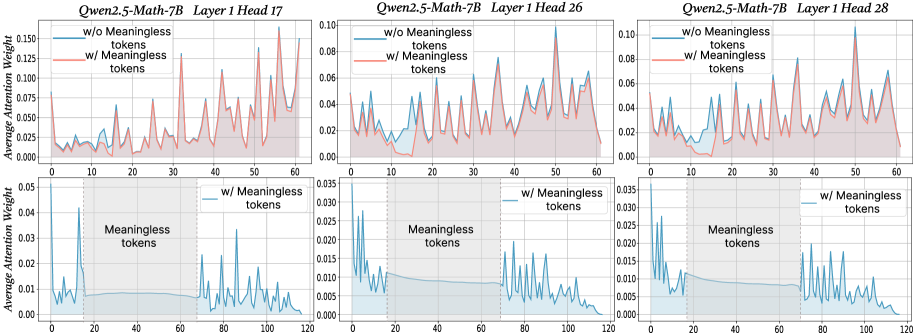
The image displays a 2x3 grid of six line charts analyzing the "Average Attention Weight" across token positions for different attention heads in the Qwen2.5-Math-7B model. The analysis compares model behavior with and without the inclusion of "Meaningless tokens." The top row (3 charts) compares the two conditions directly over a token position range of 0-60. The bottom row (3 charts) isolates and details the attention pattern specifically on the "Meaningless tokens" themselves over a wider range (0-120).
### Components/Axes
* **Chart Titles:** Each chart is titled with the model name and specific layer/head:
* Top Row (Left to Right): `Qwen2.5-Math-7B Layer 1 Head 17`, `Qwen2.5-Math-7B Layer 1 Head 26`, `Qwen2.5-Math-7B Layer 1 Head 28`.
* Bottom Row (Left to Right): Same titles as above, corresponding to the same heads.
* **Y-Axis:** Labeled `Average Attention Weight`. The scale varies:
* Top Row Charts: Range from 0.00 to approximately 0.10, 0.10, and 0.10 respectively.
* Bottom Row Charts: Range from 0.000 to approximately 0.05, 0.035, and 0.035 respectively.
* **X-Axis:** Represents token position index.
* Top Row Charts: Range from 0 to 60.
* Bottom Row Charts: Range from 0 to 120.
* **Legend (Top Row Charts):** Located in the top-left corner of each chart.
* Blue Line: `w/o Meaningless tokens`
* Red Line: `w/ Meaningless tokens`
* **Legend/Annotation (Bottom Row Charts):** A label `w/ Meaningless tokens` with a blue line sample is placed in the top-right area. The region containing the meaningless tokens is shaded in light blue and labeled `Meaningless tokens` within the plot area.
### Detailed Analysis
**Top Row Charts (Comparison over positions 0-60):**
1. **Head 17 (Top-Left):**
* **Trend:** Both lines show high volatility with multiple sharp peaks. The red line (`w/ Meaningless tokens`) generally exhibits higher peaks than the blue line.
* **Key Points:** The red line has its highest peak (~0.16) near position 55. The blue line's highest peak (~0.08) is around position 30. Both lines show a notable dip between positions 10-20.
2. **Head 26 (Top-Center):**
* **Trend:** Similar volatile pattern. The red line's peaks are consistently more pronounced than the blue line's.
* **Key Points:** The red line's maximum peak (~0.09) occurs near position 50. The blue line's highest point (~0.06) is around position 55. A significant valley is present for both lines between positions 10-20.
3. **Head 28 (Top-Right):**
* **Trend:** Follows the same pattern of volatility, with the red line showing greater amplitude in its fluctuations.
* **Key Points:** The red line peaks at ~0.10 near position 50. The blue line's highest peak (~0.07) is also near position 50. A deep trough is visible for both between positions 10-20.
**Bottom Row Charts (Focus on Meaningless Tokens, positions 0-120):**
* **Common Structure:** All three charts show a distinct pattern. There is an initial spike in attention at the very beginning (position 0-5). This is followed by a relatively flat, low-attention plateau from roughly position 20 to 70. After position 70, the attention weight becomes highly volatile again with multiple sharp peaks until the end of the sequence.
* **Head 17 (Bottom-Left):** The initial spike reaches ~0.045. The volatile region after position 70 has peaks up to ~0.03.
* **Head 26 (Bottom-Center):** The initial spike is ~0.030. Peaks in the later volatile region reach ~0.020.
* **Head 28 (Bottom-Right):** The initial spike is ~0.030. Later peaks reach ~0.015.
### Key Observations
1. **Amplified Attention with Meaningless Tokens:** In the direct comparison (top row), the inclusion of meaningless tokens (red line) consistently leads to higher maximum attention weights and more extreme fluctuations compared to the condition without them (blue line).
2. **Consistent Attention Dip:** All three heads in the top row show a characteristic dip in attention weight for both conditions between token positions 10 and 20.
3. **Distinct Pattern for Meaningless Tokens:** The bottom row reveals a unique, three-phase attention pattern specifically for meaningless tokens: an initial high-attention burst, a long period of low/flat attention, and a final phase of high volatility.
4. **Head Similarity:** While the absolute scales differ, the qualitative patterns (volatility, dip location, three-phase structure) are remarkably consistent across Heads 17, 26, and 28.
### Interpretation
The data suggests that "Meaningless tokens" are not ignored by the model's attention mechanism; instead, they actively alter its behavior. Their presence (red lines, top row) appears to "excite" or destabilize the attention patterns, leading to higher and more variable attention weights across the board.
The unique three-phase pattern in the bottom row indicates a specific processing strategy for these tokens. The initial spike suggests the model pays strong immediate attention to them upon encounter. The subsequent flat plateau implies a period of sustained, low-level processing or perhaps a "holding pattern." The final volatile phase could indicate that these tokens become relevant again later in the sequence, possibly interacting with other content.
The consistent dip between positions 10-20 in the top row charts is a notable structural feature of the model's attention in this layer, independent of the meaningless token condition. This might correspond to a specific syntactic or semantic boundary in the input sequences used for this analysis.
Overall, the charts demonstrate that meaningless tokens are a significant variable in the model's internal computations, influencing global attention dynamics and exhibiting their own distinct temporal processing signature.