## Line Graphs: Qwen2.5-Math-7B Layer 1 Head Attention Weights
### Overview
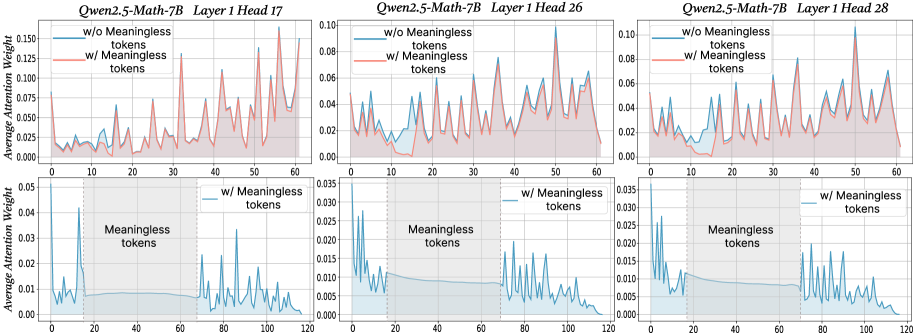
The image contains six line graphs comparing attention weight distributions across token positions for three different attention heads (17, 26, 28) in Layer 1 of the Qwen2.5-Math-7B model. Each graph contrasts two scenarios: "w/o Meaningless tokens" (blue line) and "w/ Meaningless tokens" (red line), with shaded regions representing confidence intervals.
### Components/Axes
- **X-axis**: Token Position (0–120) in all graphs
- **Y-axis**: Average Attention Weight (0–0.15) in all graphs
- **Legends**:
- Blue line: "w/o Meaningless tokens"
- Red line: "w/ Meaningless tokens"
- **Shaded Regions**: Confidence intervals (lighter blue for "w/o", lighter red for "w/")
### Detailed Analysis
#### Layer 1 Head 17
- **Trend**: Red line ("w/") shows 2–3x higher peak attention weights (up to ~0.12) compared to blue line (~0.04–0.06). Both lines exhibit periodic spikes, but red line's peaks are sharper and more frequent.
- **Key Data Points**:
- Blue line: Max ~0.06 at token 10
- Red line: Max ~0.12 at token 30
#### Layer 1 Head 26
- **Trend**: Red line dominates with sustained higher weights (avg ~0.06–0.08 vs ~0.03–0.05 for blue). Shaded regions overlap significantly in the middle token range (40–80).
- **Key Data Points**:
- Blue line: Max ~0.05 at token 20
- Red line: Max ~0.08 at token 50
#### Layer 1 Head 28
- **Trend**: Red line exhibits erratic spikes (up to ~0.10) with wider confidence intervals. Blue line remains relatively flat (~0.02–0.04) with minimal variation.
- **Key Data Points**:
- Blue line: Max ~0.04 at token 10
- Red line: Max ~0.10 at token 90
### Key Observations
1. **Consistent Pattern**: All heads show increased attention weights when meaningless tokens are included, with red lines consistently above blue lines.
2. **Confidence Intervals**: Shaded regions for "w/" tokens are 2–3x wider than "w/o" in most cases, indicating greater variability.
3. **Token Position Correlation**: Peaks in red lines often align with specific token positions (e.g., token 30 in Head 17, token 90 in Head 28), suggesting potential positional significance.
### Interpretation
The data demonstrates that including meaningless tokens significantly alters attention distribution patterns:
- **Mechanistic Insight**: The model allocates disproportionately higher attention to meaningless tokens in specific positions, potentially indicating learned positional biases or noise amplification.
- **Robustness Implications**: Wider confidence intervals for "w/" tokens suggest reduced stability in attention patterns when irrelevant tokens are present.
- **Head-Specific Behavior**: Head 28 shows the most dramatic divergence between conditions, possibly reflecting specialized processing of positional information.
The findings highlight the importance of token filtering in transformer architectures and suggest that meaningless tokens may act as positional anchors influencing attention dynamics.