## Diagram: Acoustic Simulation - Speaker Array and Wave Propagation
### Overview
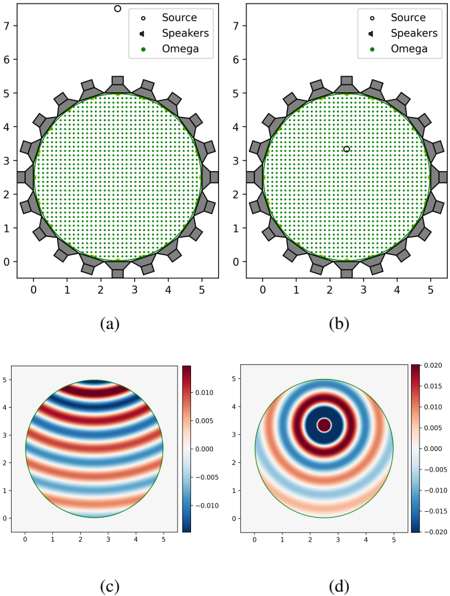
The image presents four diagrams (labeled a, b, c, and d) illustrating an acoustic simulation. Diagrams (a) and (b) depict a circular array of speakers with a central source, while diagrams (c) and (d) visualize the resulting wave propagation patterns. The diagrams appear to be related to sound field control or optimization.
### Components/Axes
Each diagram shares the following characteristics:
* **Axes:** Both x and y axes range from approximately 0 to 5, with tick marks at integer values.
* **Legend:** A common legend appears in the top-right corner of diagrams (a) and (b):
* Black circles: "Source"
* Grey squares: "Speakers"
* Green squares: "Omega"
* **Diagram (a) & (b):** Circular arrangement of speakers around a central point.
* **Diagram (c) & (d):** Color-coded wave propagation patterns with a colorbar indicating values from -0.020 to 0.020.
### Detailed Analysis or Content Details
**Diagram (a):**
* A circular array of approximately 20 speakers (grey squares) surrounds a central source (black circle).
* The "Omega" point (green square) is located near the center, slightly offset.
* The speaker arrangement is evenly spaced around the circumference.
* The interior of the circle is filled with a green dotted pattern.
**Diagram (b):**
* Similar to (a), a circular array of approximately 20 speakers (grey squares) surrounds a central source (black circle).
* The "Omega" point (green square) is located at the center of the circle.
* The speaker arrangement is evenly spaced around the circumference.
* The interior of the circle is filled with a green dotted pattern.
**Diagram (c):**
* Displays a wave propagation pattern with concentric arcs.
* The color gradient ranges from blue (approximately -0.010) to red (approximately 0.010).
* The pattern appears symmetrical, with alternating red and blue arcs.
* The colorbar on the right indicates the value scale.
**Diagram (d):**
* Displays a wave propagation pattern with concentric circles.
* The color gradient ranges from dark blue (approximately -0.020) to dark red (approximately 0.020).
* A central circular region is highlighted with a purple/blue ring.
* The colorbar on the right indicates the value scale.
### Key Observations
* The primary difference between diagrams (a) and (b) is the position of the "Omega" point. In (a), it's off-center, while in (b), it's at the center.
* Diagrams (c) and (d) show different wave patterns. (c) exhibits arc-shaped waves, while (d) shows circular waves.
* The colorbar in (d) has a wider range (-0.020 to 0.020) compared to (c) (-0.010 to 0.010), suggesting a larger amplitude or intensity of the waves.
* The wave patterns in (c) and (d) are likely the result of the speaker array configurations shown in (a) and (b), respectively.
### Interpretation
These diagrams likely represent a study of sound field control using a circular speaker array. The "Source" represents the original sound emitter, the "Speakers" are the array used to manipulate the sound field, and "Omega" likely represents a target point where the sound field is being focused or nullified.
* **Diagrams (a) and (b)** show two different configurations of the speaker array relative to the target point "Omega". The off-center "Omega" in (a) suggests a more complex control strategy is needed, while the centered "Omega" in (b) implies a simpler, more direct control approach.
* **Diagrams (c) and (d)** visualize the resulting sound pressure distribution for each configuration. The wave patterns demonstrate how the speaker array modifies the sound field. The circular waves in (d) suggest a more focused sound field, potentially due to the centered "Omega" point. The arc-shaped waves in (c) indicate a more diffuse or complex sound field.
* The color gradients in (c) and (d) represent the sound pressure level. Red indicates positive pressure (compression), while blue indicates negative pressure (rarefaction).
The wider color range in (d) suggests a stronger sound pressure level at the target point, indicating a more effective sound field control strategy when "Omega" is centered. The diagrams collectively demonstrate how the positioning of the target point influences the resulting sound field and the effectiveness of the speaker array in controlling it. This could be relevant to applications like noise cancellation, directional audio, or acoustic focusing.