## Diagram: Wave Propagation and Interference Patterns
### Overview
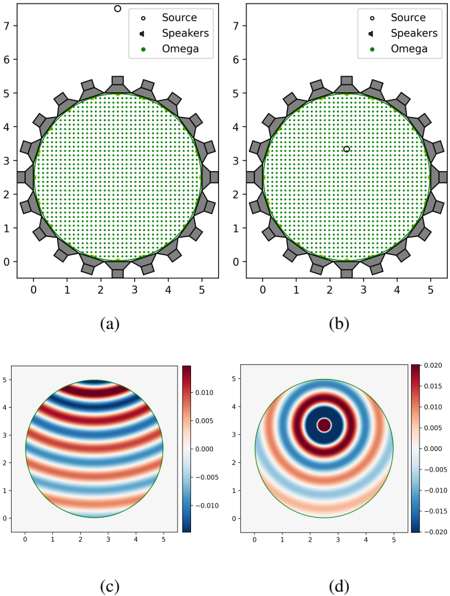
The image consists of four subplots (a-d) depicting wave propagation scenarios. Subplots (a) and (b) show geometric arrangements of sources, speakers, and Omega points, while (c) and (d) display heatmaps of wave intensity distributions. All subplots share a circular coordinate system with axes ranging from 0 to 5.
### Components/Axes
- **Axes**:
- X-axis: 0–5 (labeled "x")
- Y-axis: 0–5 (labeled "y")
- **Legends** (top-right of each subplot):
- **Source**: Black dot (•)
- **Speakers**: Black triangle (▲)
- **Omega**: Green dot (•)
- **Color Scales** (right of heatmaps):
- (c): -0.010 (dark blue) to 0.010 (dark red)
- (d): -0.020 (dark blue) to 0.020 (dark red)
### Detailed Analysis
#### Subplot (a)
- **Source**: Positioned at (0, 5) (top-left of the circle).
- **Speakers**: 12 gray triangular elements arranged uniformly around the perimeter of the circle.
- **Omega Points**: 12 green dots distributed along the circular boundary, aligned with speaker positions.
- **Pattern**: No wavefronts shown; static arrangement of components.
#### Subplot (b)
- **Source**: Positioned at (2.5, 2.5) (center of the circle).
- **Speakers**: Same 12 gray triangular elements as in (a), unchanged in position.
- **Omega Point**: Single green dot at (2.5, 2.5), coinciding with the source.
- **Pattern**: No wavefronts shown; static arrangement with centralized source.
#### Subplot (c)
- **Wave Intensity**:
- Horizontal sinusoidal pattern with alternating red (positive) and blue (negative) stripes.
- Amplitude range: -0.010 to 0.010.
- No central focus; uniform horizontal variation.
#### Subplot (d)
- **Wave Intensity**:
- Concentric circular pattern with alternating red (positive) and blue (negative) rings.
- Central dark red core (peak intensity: ~0.020).
- Amplitude range: -0.020 to 0.020.
- Radial symmetry around the center.
### Key Observations
1. **Source Positioning**:
- (a): Source at the edge of the circle.
- (b): Source at the center of the circle.
2. **Omega Points**:
- (a): Omega points on the perimeter, aligned with speakers.
- (b): Omega point at the center, overlapping the source.
3. **Wave Patterns**:
- (c): Horizontal interference pattern (no radial focus).
- (d): Radial interference pattern (centralized source effect).
4. **Amplitude**:
- (d) exhibits twice the maximum amplitude of (c), suggesting a stronger source or different boundary conditions.
### Interpretation
The diagrams illustrate two wave propagation scenarios:
1. **Edge Source (a)**:
- Source at the perimeter may simulate boundary-driven waves (e.g., acoustic reflections).
- Omega points on the perimeter could represent measurement nodes or boundary conditions.
2. **Central Source (b)**:
- Source at the center mimics omnidirectional wave generation.
- Single Omega point at the center suggests a focus on central intensity measurement.
3. **Heatmap Comparison**:
- (c) shows uniform horizontal variation, possibly from a line source or boundary effect.
- (d) demonstrates radial interference from a central source, with higher amplitude due to constructive/destructive wave interactions.
4. **Anomalies**:
- In (b), the Omega point coinciding with the source may indicate a measurement at the origin, which could be physically unrealistic for certain wave types (e.g., pressure waves at a point source).
### Technical Implications
- The transition from (a) to (b) highlights how source position alters wavefront geometry.
- Heatmaps (c) and (d) quantify interference patterns, with (d) showing a 2× amplitude increase, suggesting a direct relationship between source centrality and wave intensity.
- The use of Omega points as boundary/measurement nodes in (a) versus a central node in (b) implies different modeling approaches for wave propagation studies.