## Histogram: Coord 0 Marginal and Factor 0 Projection
### Overview
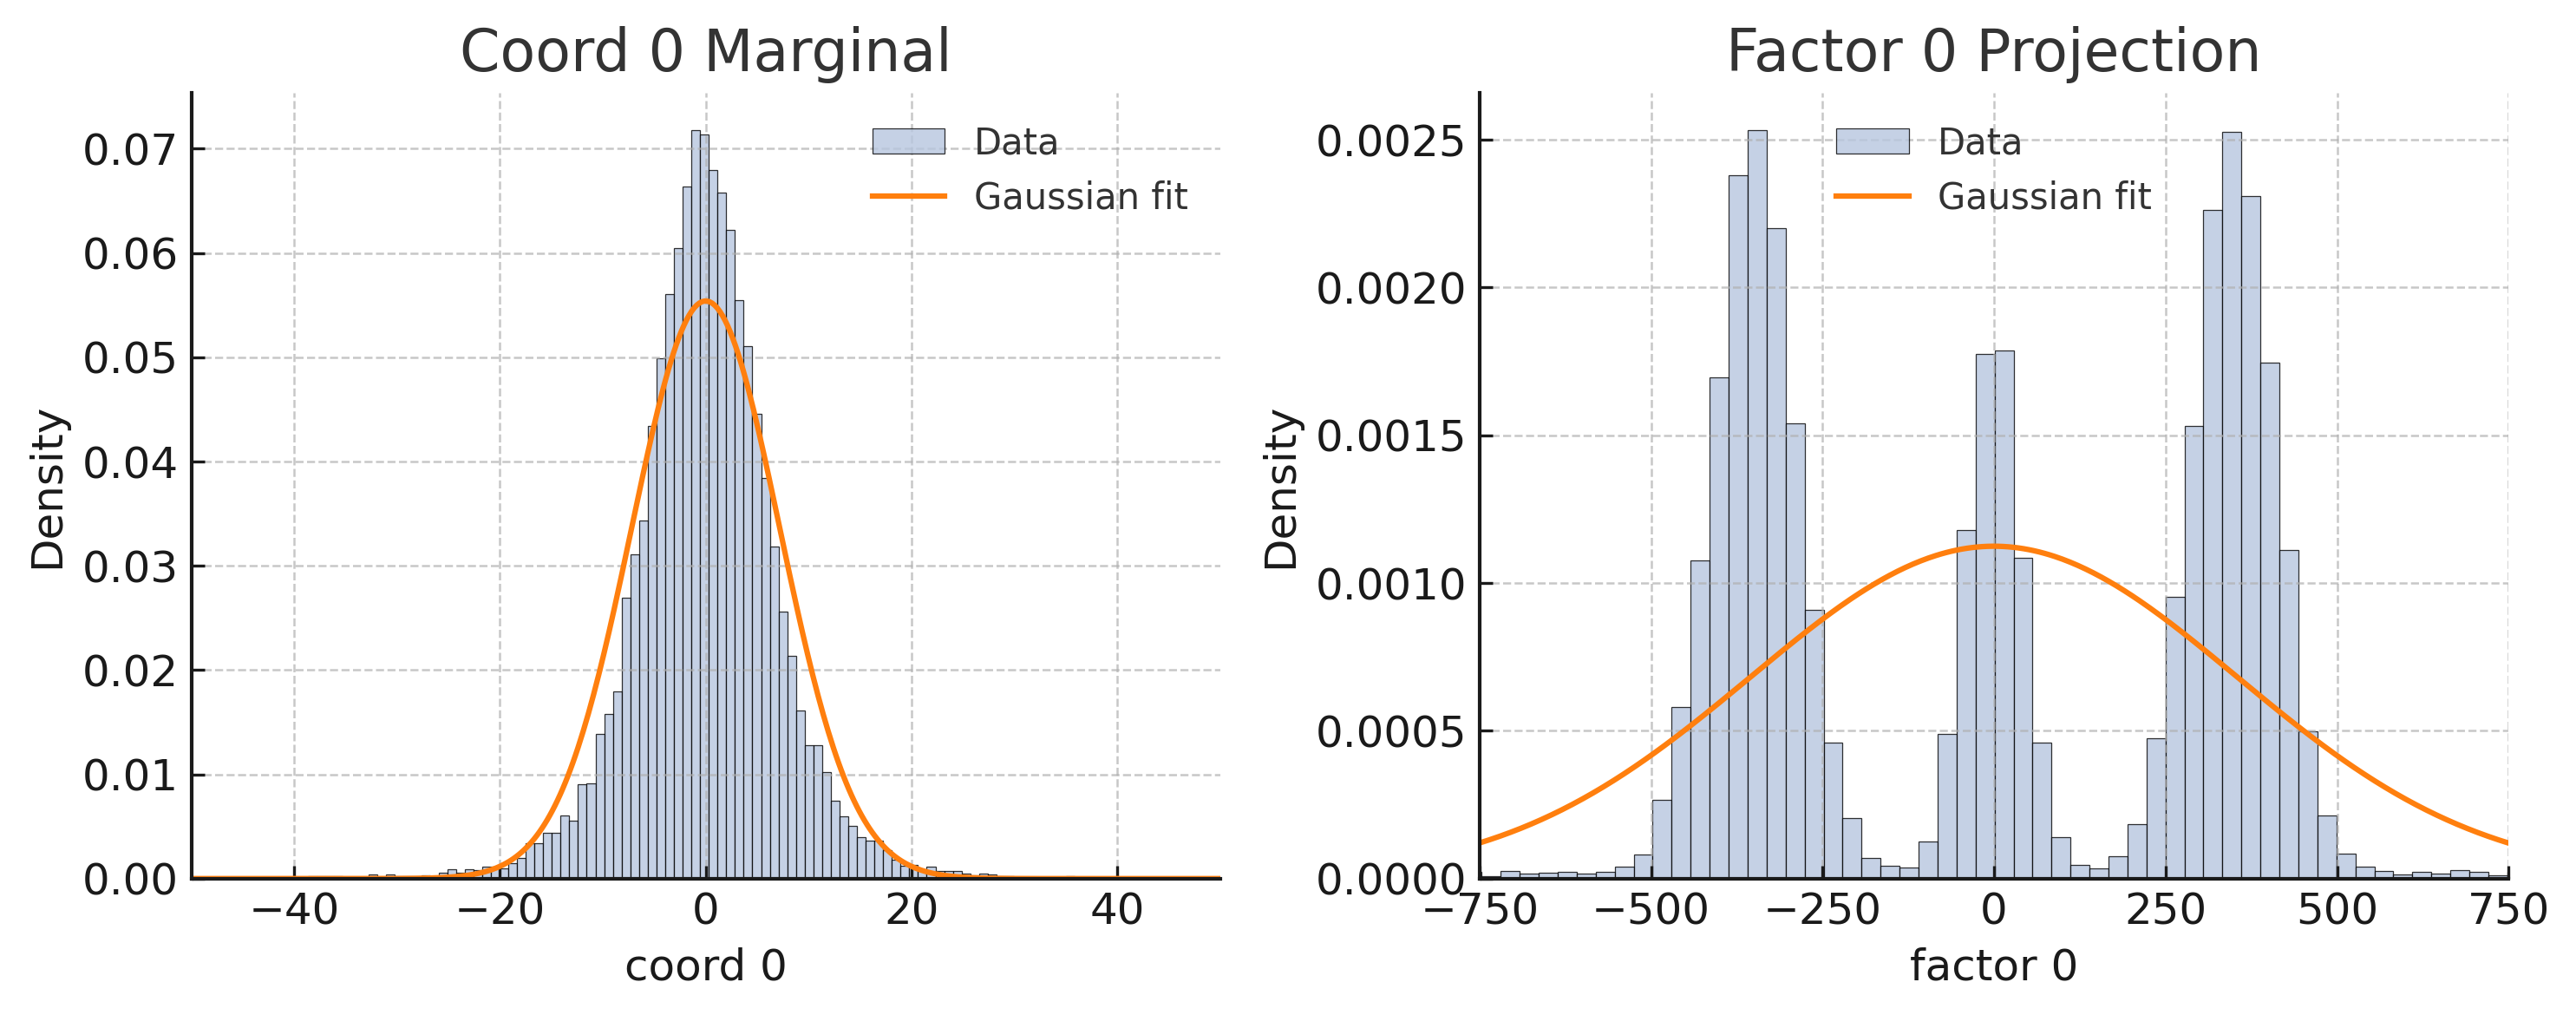
The image contains two histograms, "Coord 0 Marginal" on the left and "Factor 0 Projection" on the right. Both histograms display the density of data points. Each histogram shows the distribution of data as light blue bars, along with an overlaid orange curve representing a Gaussian fit.
### Components/Axes
**Left Histogram: Coord 0 Marginal**
* **Title:** Coord 0 Marginal
* **X-axis:** coord 0
* Scale ranges from -40 to 40, with tick marks at -40, -20, 0, 20, and 40.
* **Y-axis:** Density
* Scale ranges from 0.00 to 0.07, with tick marks at 0.00, 0.01, 0.02, 0.03, 0.04, 0.05, 0.06, and 0.07.
* **Legend (top-right):**
* Data (light blue)
* Gaussian fit (orange)
**Right Histogram: Factor 0 Projection**
* **Title:** Factor 0 Projection
* **X-axis:** factor 0
* Scale ranges from -750 to 750, with tick marks at -750, -500, -250, 0, 250, 500, and 750.
* **Y-axis:** Density
* Scale ranges from 0.0000 to 0.0025, with tick marks at 0.0000, 0.0005, 0.0010, 0.0015, 0.0020, and 0.0025.
* **Legend (top-right):**
* Data (light blue)
* Gaussian fit (orange)
### Detailed Analysis
**Left Histogram: Coord 0 Marginal**
* **Data (light blue bars):** The data is centered around 0, forming a bell-shaped distribution. The density is highest near 0 and decreases as you move away from 0 in either direction.
* **Gaussian fit (orange curve):** The orange curve represents a Gaussian distribution fitted to the data. It closely follows the shape of the data distribution, peaking around 0 and tapering off towards the extremes.
* The peak density of the data is approximately 0.07 near coord 0 = 0.
**Right Histogram: Factor 0 Projection**
* **Data (light blue bars):** The data shows three distinct peaks, one near -500, one near 0, and one near 500. The density is relatively low between these peaks.
* **Gaussian fit (orange curve):** The orange curve represents a Gaussian distribution fitted to the data. It is centered around 0 and has a much wider spread than the data distribution. The Gaussian fit does not accurately capture the multi-modal nature of the data.
* The peak density of the data is approximately 0.0025 near factor 0 = -500 and 500, and approximately 0.0018 near factor 0 = 0.
### Key Observations
* The "Coord 0 Marginal" data closely resembles a normal distribution, as evidenced by the well-fitting Gaussian curve.
* The "Factor 0 Projection" data exhibits a multi-modal distribution, with three distinct peaks. The Gaussian fit is a poor representation of this data.
### Interpretation
The "Coord 0 Marginal" histogram suggests that the data is normally distributed around 0. This could indicate that the underlying process generating this data is centered around a mean of 0 with a certain variance.
The "Factor 0 Projection" histogram reveals a more complex structure. The three peaks suggest that the data might be a mixture of three different distributions, each centered around -500, 0, and 500 respectively. The Gaussian fit fails to capture this complexity, indicating that a single normal distribution is not an appropriate model for this data. This could imply that the "Factor 0 Projection" data is influenced by multiple factors or processes.