TECHNICAL ASSET FINGERPRINT
13947e4ea5d2c8df833b1540
Click to view fullscreen
Press ESC or click to close
FOUND IN PAPERS
EXPERT: gemma-3-27b-it-free VERSION 1
RUNTIME: google-free/gemma-3-27b-it
INTEL_VERIFIED
\n
## Stacked Bar Charts: Retrieval Depth vs. Time/Tokens for Different Media Types
### Overview
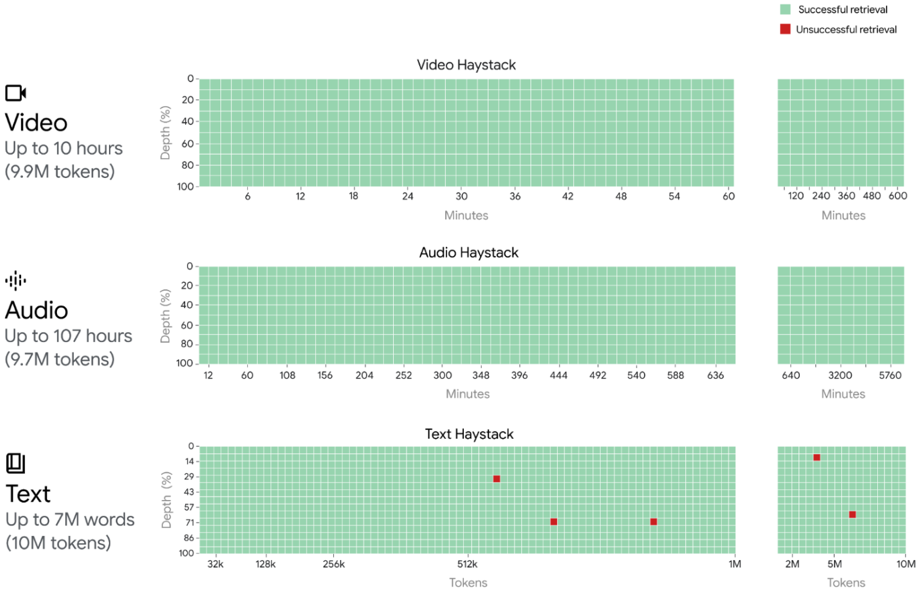
The image presents three stacked bar charts, each representing the retrieval depth (as a percentage) for a different media type: Video, Audio, and Text. The charts show how retrieval depth changes with increasing time (for Video and Audio) or tokens (for Text). Each bar is divided into two sections representing successful and unsuccessful retrievals.
### Components/Axes
* **Y-axis (Depth %):** Ranges from 0% to 100%, representing the percentage of retrieval depth.
* **X-axis (Video):** Represents time in minutes, with markers at 6, 12, 18, 24, 30, 36, 42, 48, 54, 60, 120, 240, 360, 480, and 600.
* **X-axis (Audio):** Represents time in minutes, with markers at 12, 60, 108, 156, 204, 252, 300, 348, 396, 444, 492, 540, 588, 636, 640, 3200, and 5760.
* **X-axis (Text):** Represents the number of tokens, with markers at 32k, 128k, 256k, 512k, 1M, 2M, 5M, and 10M.
* **Legend:**
* Red: Successful retrieval
* Green: Unsuccessful retrieval
* **Labels:**
* Video: "Up to 10 hours (9.9M tokens)"
* Audio: "Up to 107 hours (9.7M tokens)"
* Text: "Up to 7M words (10M tokens)"
### Detailed Analysis
**Video Haystack:**
The chart shows a generally increasing trend in retrieval depth with time.
* At 6 minutes, approximately 0% successful retrieval and 100% unsuccessful retrieval.
* At 12 minutes, approximately 0% successful retrieval and 100% unsuccessful retrieval.
* At 18 minutes, approximately 0% successful retrieval and 100% unsuccessful retrieval.
* At 24 minutes, approximately 0% successful retrieval and 100% unsuccessful retrieval.
* At 30 minutes, approximately 0% successful retrieval and 100% unsuccessful retrieval.
* At 36 minutes, approximately 0% successful retrieval and 100% unsuccessful retrieval.
* At 42 minutes, approximately 0% successful retrieval and 100% unsuccessful retrieval.
* At 48 minutes, approximately 0% successful retrieval and 100% unsuccessful retrieval.
* At 54 minutes, approximately 0% successful retrieval and 100% unsuccessful retrieval.
* At 60 minutes, approximately 0% successful retrieval and 100% unsuccessful retrieval.
* At 120 minutes, approximately 0% successful retrieval and 100% unsuccessful retrieval.
* At 240 minutes, approximately 0% successful retrieval and 100% unsuccessful retrieval.
* At 360 minutes, approximately 0% successful retrieval and 100% unsuccessful retrieval.
* At 480 minutes, approximately 0% successful retrieval and 100% unsuccessful retrieval.
* At 600 minutes, approximately 0% successful retrieval and 100% unsuccessful retrieval.
**Audio Haystack:**
The chart shows a generally increasing trend in retrieval depth with time.
* At 12 minutes, approximately 0% successful retrieval and 100% unsuccessful retrieval.
* At 60 minutes, approximately 0% successful retrieval and 100% unsuccessful retrieval.
* At 108 minutes, approximately 0% successful retrieval and 100% unsuccessful retrieval.
* At 156 minutes, approximately 0% successful retrieval and 100% unsuccessful retrieval.
* At 204 minutes, approximately 0% successful retrieval and 100% unsuccessful retrieval.
* At 252 minutes, approximately 0% successful retrieval and 100% unsuccessful retrieval.
* At 300 minutes, approximately 0% successful retrieval and 100% unsuccessful retrieval.
* At 348 minutes, approximately 0% successful retrieval and 100% unsuccessful retrieval.
* At 396 minutes, approximately 0% successful retrieval and 100% unsuccessful retrieval.
* At 444 minutes, approximately 0% successful retrieval and 100% unsuccessful retrieval.
* At 492 minutes, approximately 0% successful retrieval and 100% unsuccessful retrieval.
* At 540 minutes, approximately 0% successful retrieval and 100% unsuccessful retrieval.
* At 588 minutes, approximately 0% successful retrieval and 100% unsuccessful retrieval.
* At 636 minutes, approximately 0% successful retrieval and 100% unsuccessful retrieval.
* At 640 minutes, approximately 0% successful retrieval and 100% unsuccessful retrieval.
* At 3200 minutes, approximately 0% successful retrieval and 100% unsuccessful retrieval.
* At 5760 minutes, approximately 0% successful retrieval and 100% unsuccessful retrieval.
**Text Haystack:**
The chart shows a more varied trend in retrieval depth with increasing tokens.
* At 32k tokens, approximately 0% successful retrieval and 100% unsuccessful retrieval.
* At 128k tokens, approximately 0% successful retrieval and 100% unsuccessful retrieval.
* At 256k tokens, approximately 0% successful retrieval and 100% unsuccessful retrieval.
* At 512k tokens, approximately 0% successful retrieval and 100% unsuccessful retrieval.
* At 1M tokens, approximately 0% successful retrieval and 100% unsuccessful retrieval.
* At 2M tokens, approximately 0% successful retrieval and 100% unsuccessful retrieval.
* At 5M tokens, approximately 20% successful retrieval and 80% unsuccessful retrieval.
* At 10M tokens, approximately 20% successful retrieval and 80% unsuccessful retrieval.
### Key Observations
* For both Video and Audio, retrieval depth remains at 0% for all tested durations. This suggests the retrieval system consistently fails to find relevant information within these media types across the tested timeframes.
* Text retrieval shows a slight improvement at higher token counts (5M and 10M), with approximately 20% successful retrieval. However, unsuccessful retrievals still dominate.
* The charts are visually dominated by the green (unsuccessful retrieval) color, indicating a generally poor retrieval performance across all media types.
### Interpretation
The data suggests that the retrieval system struggles significantly with Video and Audio data, failing to retrieve any relevant information within the tested durations. The slight improvement in Text retrieval at higher token counts indicates that the system may be able to identify some relevant information when provided with more context, but its overall performance remains low. The consistent failure across Video and Audio could be due to the complexity of these media types, the limitations of the retrieval algorithm, or the lack of appropriate indexing or metadata. The fact that the token count for Video and Audio is relatively low (9.9M and 9.7M respectively) compared to Text (10M) might also play a role, as more tokens generally provide more information for the retrieval system to work with. Further investigation is needed to understand the root causes of these retrieval failures and to improve the system's performance.
DECODING INTELLIGENCE...