## Chart/Diagram Type: Multi-axis Retrieval Performance Analysis
### Overview
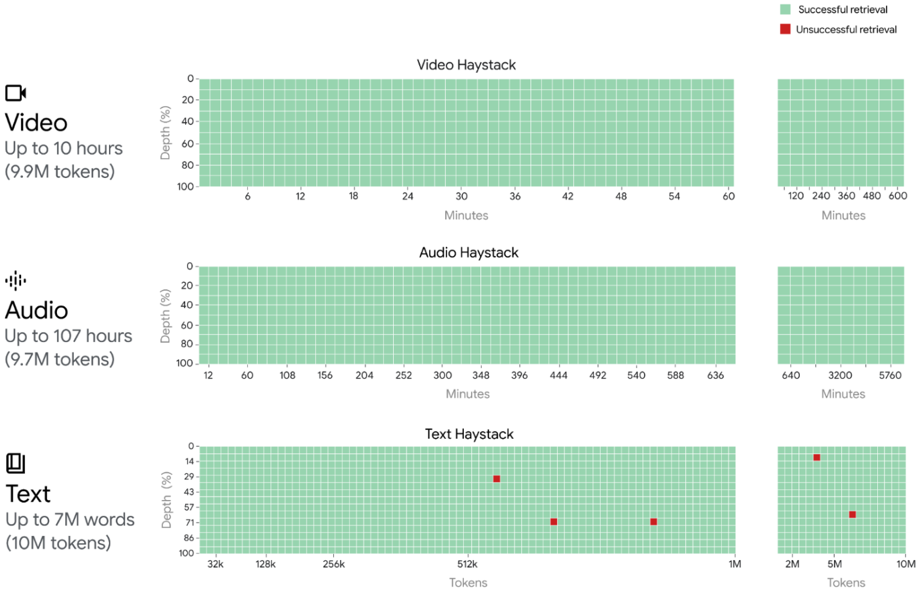
The image presents three comparative visualizations analyzing retrieval performance across different media types (Video, Audio, Text) using two chart formats:
1. Main Haystack charts showing performance over time/token ranges
2. Zoomed-in views focusing on specific ranges
All charts use a green/red color scheme to indicate successful/unsuccessful retrievals.
### Components/Axes
**Legend** (top-right corner):
- Green squares: Successful retrieval
- Red squares: Unsuccessful retrieval
**Video Section**:
- Main Chart:
- X-axis: Minutes (0-60)
- Y-axis: Depth (%) (0-100)
- Title: "Video Haystack"
- Subtitle: "Up to 10 hours (9.9M tokens)"
- Zoomed-in View:
- X-axis: Minutes (120-600)
- Y-axis: Depth (%) (0-100)
**Audio Section**:
- Main Chart:
- X-axis: Minutes (0-636)
- Y-axis: Depth (%) (0-100)
- Title: "Audio Haystack"
- Subtitle: "Up to 107 hours (9.7M tokens)"
- Zoomed-in View:
- X-axis: Minutes (640-5760)
- Y-axis: Depth (%) (0-100)
**Text Section**:
- Main Chart:
- X-axis: Tokens (32k-1M)
- Y-axis: Depth (%) (0-100)
- Title: "Text Haystack"
- Subtitle: "Up to 7M words (10M tokens)"
- Zoomed-in View:
- X-axis: Tokens (2M-10M)
- Y-axis: Depth (%) (0-100)
### Detailed Analysis
**Video Haystack**:
- Main chart shows 100% successful retrieval (green) across all durations
- Zoomed-in view maintains 100% success rate up to 600 minutes
- No red markers present in either view
**Audio Haystack**:
- Main chart shows 100% successful retrieval up to 636 minutes
- Zoomed-in view shows 100% success rate up to 5760 minutes
- No red markers present in either view
**Text Haystack**:
- Main chart shows:
- 100% success at lower token ranges (32k-512k)
- First failure at 512k tokens (43% depth)
- Additional failures at 750k (57%) and 900k tokens (71%)
- Zoomed-in view shows:
- 100% success at 2M tokens
- Failures at 5M (86%) and 7M tokens (unlabeled percentage)
- Text section contains 5 red markers total (3 in main, 2 in zoomed)
### Key Observations
1. Video and Audio processing maintains perfect retrieval success across all measured durations
2. Text processing shows decreasing success rates with increasing token counts
3. Text failures cluster at specific thresholds (512k, 750k, 900k tokens)
4. Zoomed-in views reveal text failures at higher token ranges (5M-7M)
5. All media types show 100% success at their lowest measurement points
### Interpretation
The data demonstrates fundamental differences in retrieval reliability across media types:
- **Video/Audio**: Maintain consistent performance regardless of duration/token count, suggesting robust processing pipelines optimized for temporal data
- **Text**: Shows capacity limitations, with failures emerging at specific token thresholds. The 512k token failure point (43% depth) suggests a critical transition point where processing complexity exceeds system capabilities
- The 7M word limit (10M tokens) in text processing appears to be a hard boundary, with failures occurring before reaching this maximum capacity
- The absence of failures in video/audio processing up to 107 hours (9.7M tokens) indicates these systems handle larger volumes more effectively than text processing
The visualization pattern reveals that text-based retrieval systems face unique scalability challenges compared to their audio/video counterparts, particularly in handling large volumes of sequential data.