## Bar Chart: Model Accuracy vs. Problem Difficulty
### Overview
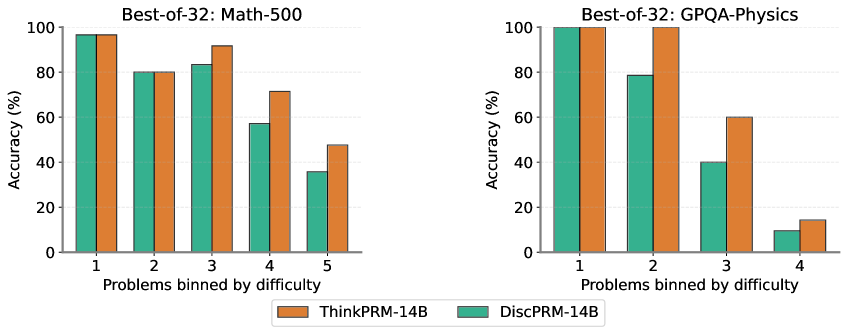
The image presents two bar charts comparing the accuracy of two models, ThinkPRM-14B and DiscPRM-14B, across problems binned by difficulty. The left chart focuses on "Math-500" problems, while the right chart focuses on "GPQA-Physics" problems. Both charts display accuracy (in percentage) on the y-axis and problem difficulty (binned) on the x-axis.
### Components/Axes
* **Titles:**
* Left Chart: "Best-of-32: Math-500"
* Right Chart: "Best-of-32: GPQA-Physics"
* **Y-axis:** "Accuracy (%)", ranging from 0 to 100 in increments of 20.
* **X-axis:** "Problems binned by difficulty".
* Left Chart: Categories 1, 2, 3, 4, 5
* Right Chart: Categories 1, 2, 3, 4
* **Legend:** Located at the bottom of the image.
* Orange: "ThinkPRM-14B"
* Teal: "DiscPRM-14B"
### Detailed Analysis
**Left Chart: Math-500**
* **ThinkPRM-14B (Orange):**
* Difficulty 1: Accuracy ~97%
* Difficulty 2: Accuracy ~80%
* Difficulty 3: Accuracy ~92%
* Difficulty 4: Accuracy ~72%
* Difficulty 5: Accuracy ~48%
* Trend: Generally decreasing accuracy as difficulty increases.
* **DiscPRM-14B (Teal):**
* Difficulty 1: Accuracy ~97%
* Difficulty 2: Accuracy ~80%
* Difficulty 3: Accuracy ~83%
* Difficulty 4: Accuracy ~58%
* Difficulty 5: Accuracy ~36%
* Trend: Decreasing accuracy as difficulty increases.
**Right Chart: GPQA-Physics**
* **ThinkPRM-14B (Orange):**
* Difficulty 1: Accuracy ~99%
* Difficulty 2: Accuracy ~97%
* Difficulty 3: Accuracy ~57%
* Difficulty 4: Accuracy ~14%
* Trend: Decreasing accuracy as difficulty increases.
* **DiscPRM-14B (Teal):**
* Difficulty 1: Accuracy ~99%
* Difficulty 2: Accuracy ~79%
* Difficulty 3: Accuracy ~40%
* Difficulty 4: Accuracy ~10%
* Trend: Decreasing accuracy as difficulty increases.
### Key Observations
* Both models perform well on easier problems (difficulty 1 and 2) for both Math-500 and GPQA-Physics.
* Accuracy decreases as problem difficulty increases for both models and both problem sets.
* For Math-500, ThinkPRM-14B generally outperforms DiscPRM-14B, especially at difficulty levels 3, 4, and 5.
* For GPQA-Physics, ThinkPRM-14B outperforms DiscPRM-14B at difficulty levels 3 and 4.
* The drop in accuracy is more pronounced for GPQA-Physics than for Math-500 as difficulty increases.
### Interpretation
The data suggests that both models are more proficient at solving easier problems. As the difficulty level increases, the accuracy of both models decreases, indicating a limitation in their ability to handle more complex problems. The ThinkPRM-14B model generally performs better than the DiscPRM-14B model, especially for Math-500 problems. The more significant drop in accuracy for GPQA-Physics problems suggests that these problems are inherently more challenging for both models compared to Math-500 problems. The "Best-of-32" prefix in the titles likely refers to the number of attempts or samples used to determine the accuracy, implying a statistical approach to evaluating model performance.