## Bar Charts: Best-of-32 Performance Comparison
### Overview
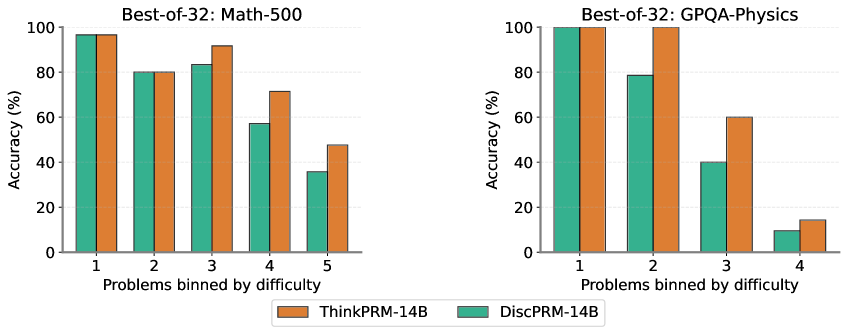
The image contains two side-by-side bar charts comparing the accuracy of two models, **ThinkPRM-14B** (orange) and **DiscPRM-14B** (teal), across problem sets binned by difficulty. The left chart evaluates performance on **Math-500**, while the right chart evaluates **GPQA-Physics**. Each chart uses a "Best-of-32" evaluation protocol, with accuracy reported in percentage.
### Components/Axes
- **Left Chart (Math-500)**:
- **X-axis**: Problems binned by difficulty (1–5).
- **Y-axis**: Accuracy (%) from 0 to 100.
- **Legend**: Orange = ThinkPRM-14B, Teal = DiscPRM-14B.
- **Right Chart (GPQA-Physics)**:
- **X-axis**: Problems binned by difficulty (1–4).
- **Y-axis**: Accuracy (%) from 0 to 100.
- **Legend**: Orange = ThinkPRM-14B, Teal = DiscPRM-14B.
### Detailed Analysis
#### Math-500 (Left Chart)
- **Problem 1**:
- ThinkPRM-14B: ~98%
- DiscPRM-14B: ~98%
- **Problem 2**:
- ThinkPRM-14B: ~80%
- DiscPRM-14B: ~80%
- **Problem 3**:
- ThinkPRM-14B: ~88%
- DiscPRM-14B: ~82%
- **Problem 4**:
- ThinkPRM-14B: ~70%
- DiscPRM-14B: ~58%
- **Problem 5**:
- ThinkPRM-14B: ~48%
- DiscPRM-14B: ~36%
#### GPQA-Physics (Right Chart)
- **Problem 1**:
- ThinkPRM-14B: ~100%
- DiscPRM-14B: ~100%
- **Problem 2**:
- ThinkPRM-14B: ~100%
- DiscPRM-14B: ~78%
- **Problem 3**:
- ThinkPRM-14B: ~60%
- DiscPRM-14B: ~40%
- **Problem 4**:
- ThinkPRM-14B: ~14%
- DiscPRM-14B: ~10%
### Key Observations
1. **Math-500**:
- Both models show declining accuracy with increasing difficulty.
- DiscPRM-14B consistently underperforms ThinkPRM-14B in Problems 3–5.
- Problem 5 has the largest gap (~12% difference).
2. **GPQA-Physics**:
- ThinkPRM-14B dominates in Problems 1–2 but collapses in Problem 4.
- DiscPRM-14B maintains higher accuracy in Problem 3 but also drops sharply in Problem 4.
- Problem 4 has a drastic performance gap (~50% difference).
3. **General Trends**:
- Both models struggle with higher-difficulty problems.
- DiscPRM-14B exhibits more consistent performance in Math-500 but falters in Physics.
### Interpretation
The data suggests that **ThinkPRM-14B** excels in lower-difficulty problems across both domains but experiences significant performance degradation in higher-difficulty tasks. **DiscPRM-14B** performs more consistently in Math-500 but struggles disproportionately in GPQA-Physics, particularly in Problem 4. The stark drop in Problem 4 for both models in GPQA-Physics may indicate a fundamental limitation in handling complex physics problems, even when binned as "high difficulty." The absence of Problem 5 in GPQA-Physics (compared to Math-500) could reflect either data scarcity or a different difficulty distribution between the two datasets.
The "Best-of-32" protocol implies that these results represent the best performance across 32 trials, suggesting that even the models' optimal outputs degrade under increased problem complexity.