## Line Chart: Validation Accuracy vs. Epoch
### Overview
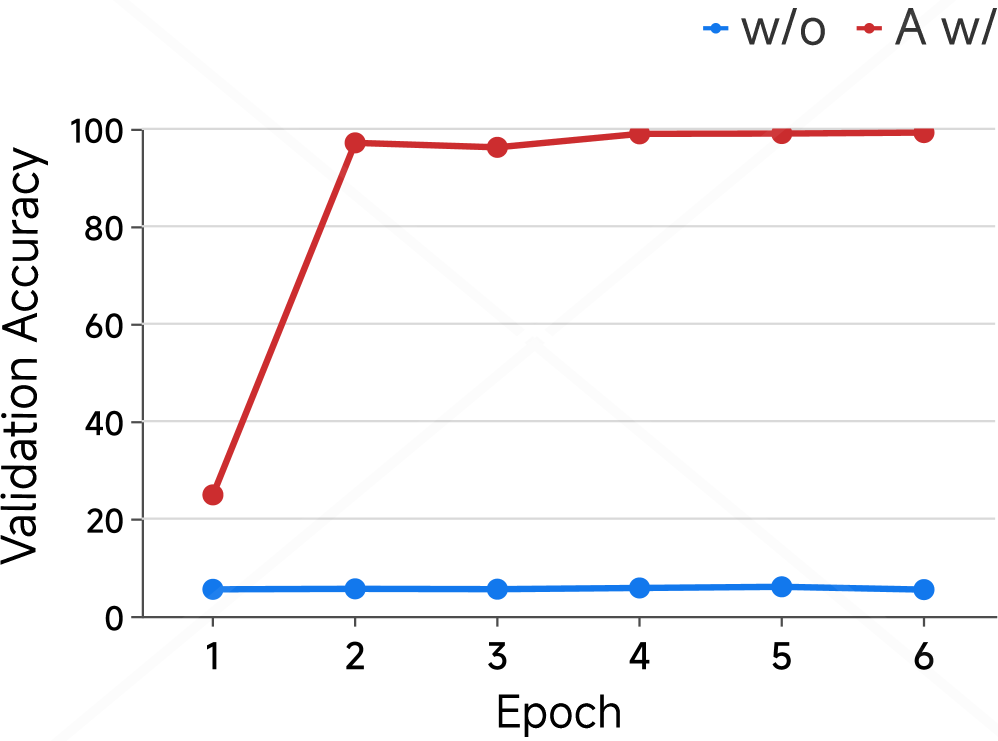
The image is a line chart comparing the validation accuracy of two models, one labeled "w/o" (blue line) and the other "A w/" (red line), over six epochs. The chart shows how the validation accuracy changes as the models are trained.
### Components/Axes
* **X-axis:** Epoch, labeled from 1 to 6.
* **Y-axis:** Validation Accuracy, labeled from 0 to 100 in increments of 20.
* **Legend:** Located at the top-right of the chart.
* Blue line with circle marker: "w/o"
* Red line with circle marker: "A w/"
### Detailed Analysis
* **"w/o" (Blue Line):** The validation accuracy remains relatively constant across all epochs.
* Epoch 1: Approximately 6
* Epoch 2: Approximately 6
* Epoch 3: Approximately 6
* Epoch 4: Approximately 7
* Epoch 5: Approximately 7
* Epoch 6: Approximately 6
* **"A w/" (Red Line):** The validation accuracy increases sharply from epoch 1 to epoch 2, then plateaus for the remaining epochs.
* Epoch 1: Approximately 25
* Epoch 2: Approximately 98
* Epoch 3: Approximately 97
* Epoch 4: Approximately 99
* Epoch 5: Approximately 99
* Epoch 6: Approximately 99
### Key Observations
* The "A w/" model significantly outperforms the "w/o" model in terms of validation accuracy.
* The "A w/" model reaches a high validation accuracy very quickly (by epoch 2) and maintains it throughout the remaining epochs.
* The "w/o" model shows very little improvement in validation accuracy over the epochs.
### Interpretation
The data suggests that the "A w/" model is significantly better than the "w/o" model. The rapid increase in validation accuracy for "A w/" indicates that it learns effectively during the initial epochs. The plateauing of the "A w/" model's accuracy after epoch 2 suggests that further training may not lead to substantial improvements. The consistently low accuracy of the "w/o" model indicates that it may not be learning effectively or that it requires a different training approach. The "A w/" model is likely a better choice for the given task.