## Line Graph: Validation Accuracy Across Epochs
### Overview
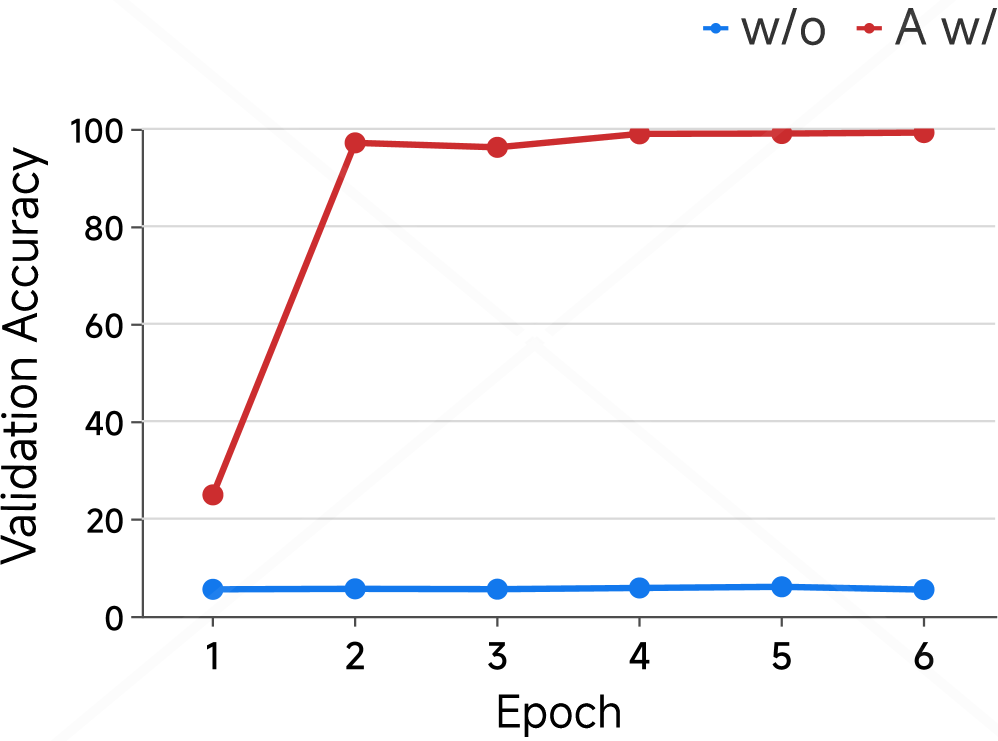
The image depicts a line graph comparing validation accuracy trends for two scenarios ("A w/" and "w/o") across six training epochs. The red line ("A w/") shows a sharp initial increase followed by stabilization, while the blue line ("w/o") remains nearly flat throughout.
### Components/Axes
- **X-axis (Epoch)**: Labeled "Epoch" with integer markers from 1 to 6.
- **Y-axis (Validation Accuracy)**: Labeled "Validation Accuracy" with a scale from 0 to 100.
- **Legend**: Located in the top-right corner, with:
- **Red line**: Labeled "A w/" (with a slash through the "A").
- **Blue line**: Labeled "w/o" (without a slash).
### Detailed Analysis
- **Red Line ("A w/")**:
- **Epoch 1**: ~25 accuracy.
- **Epoch 2**: Jumps to ~95 accuracy.
- **Epochs 3–6**: Stabilizes between ~98–100 accuracy.
- **Blue Line ("w/o")**:
- **All Epochs**: Remains flat at ~5 accuracy.
### Key Observations
1. The red line ("A w/") exhibits a **sharp increase** from epoch 1 to 2 (~25 → ~95), followed by a **plateau** at near-maximum accuracy.
2. The blue line ("w/o") shows **no meaningful change** across all epochs, remaining at ~5 accuracy.
3. The red line’s trajectory suggests a **dramatic improvement** in performance when "A w/" is applied, while "w/o" yields negligible results.
### Interpretation
The data implies that the inclusion of "A w/" (possibly a model component, algorithm, or parameter) drives a **rapid and substantial improvement** in validation accuracy, stabilizing at high performance by epoch 3. In contrast, the "w/o" scenario demonstrates **no learning or adaptation** over time, indicating that the absence of "A w/" results in a model that fails to improve. This could highlight the critical role of "A w/" in the system’s effectiveness, potentially serving as a key differentiator in model design or training methodology.