## Chart: AUROC vs. Number Explanations
### Overview
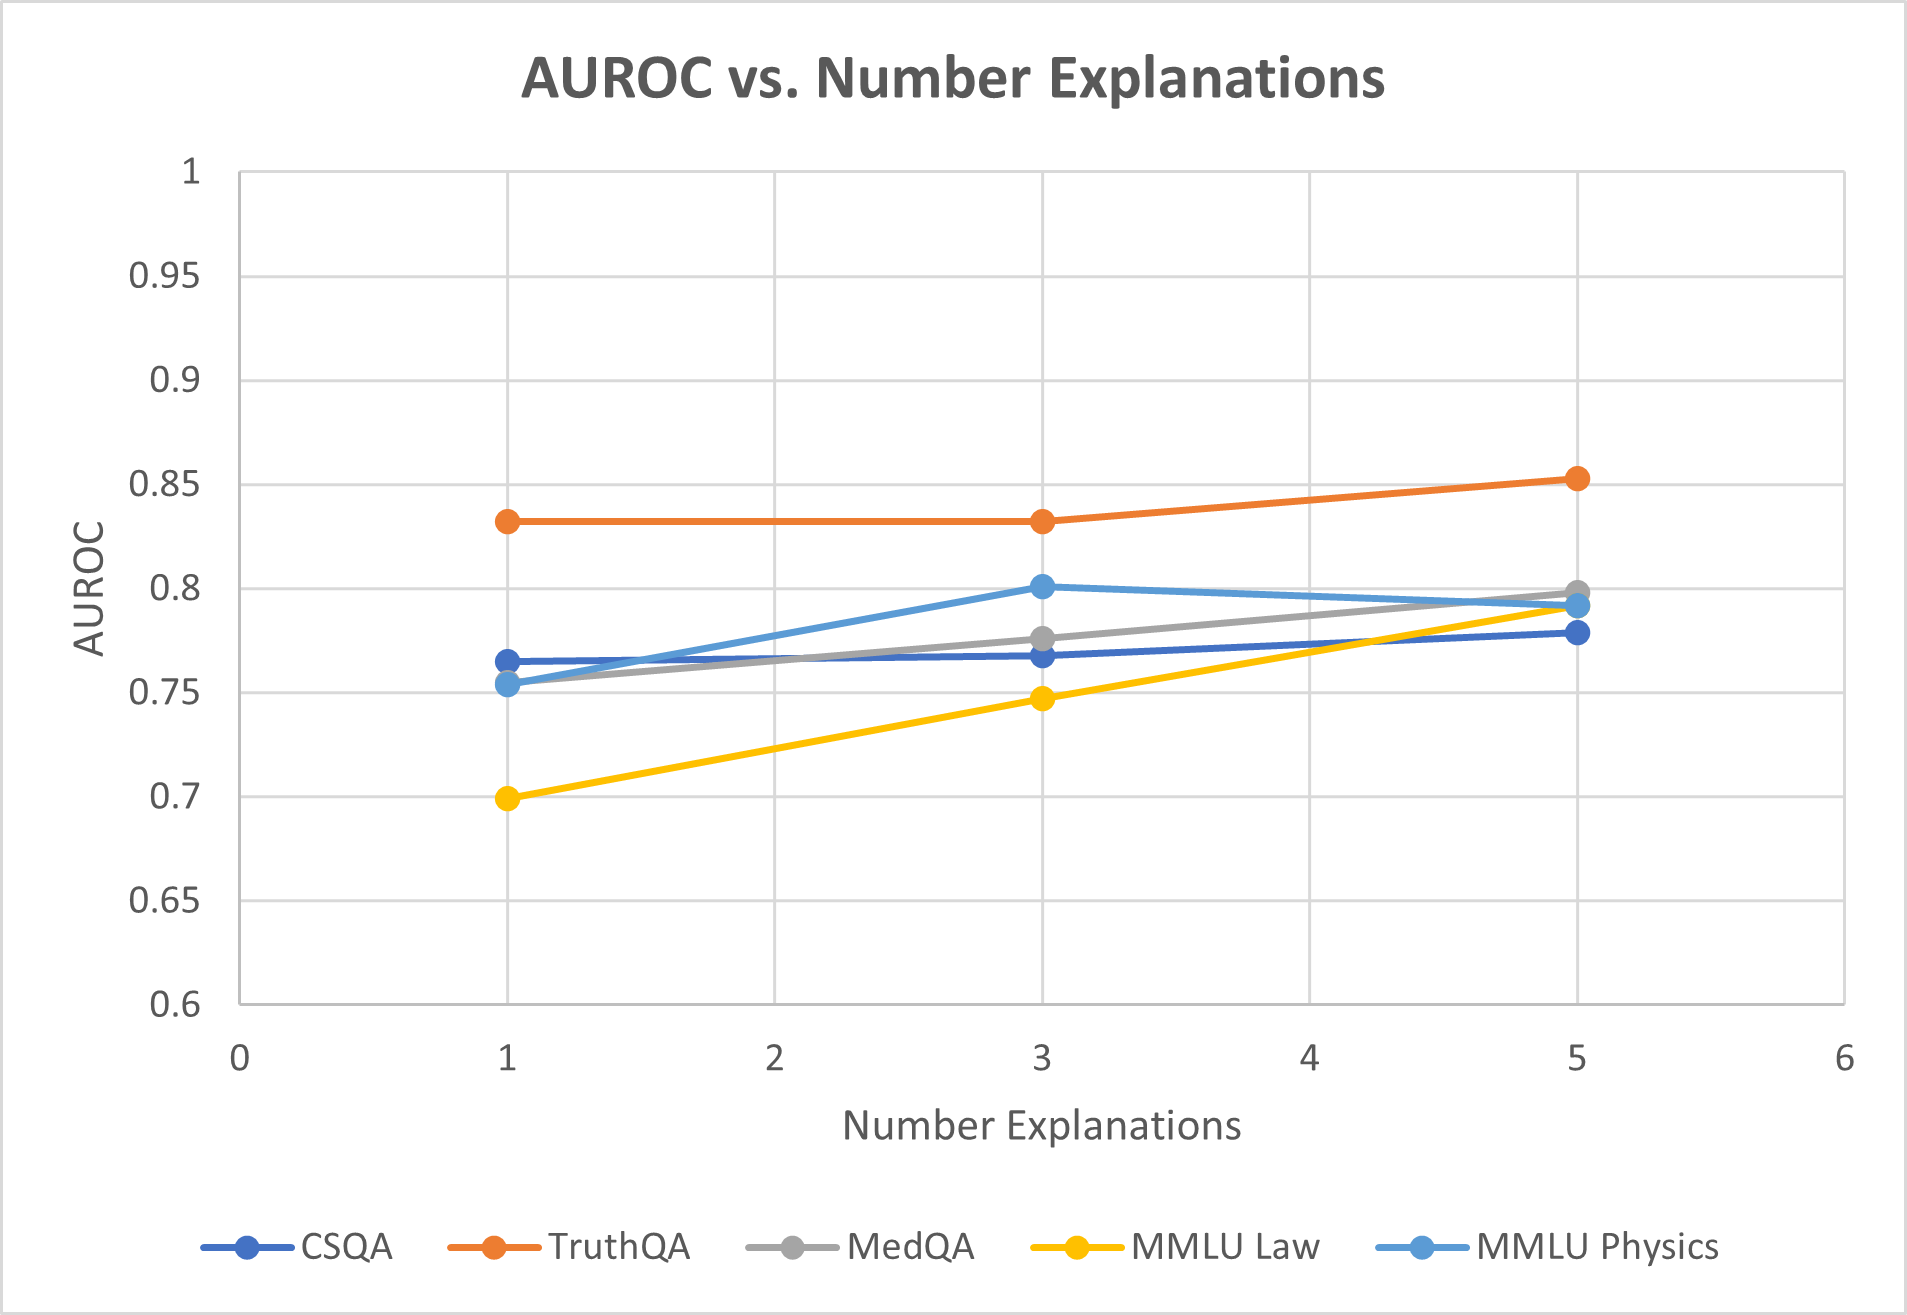
The image is a line chart comparing the Area Under the Receiver Operating Characteristic curve (AUROC) against the number of explanations for five different datasets: CSQA, TruthQA, MedQA, MMLU Law, and MMLU Physics. The x-axis represents the number of explanations, ranging from 0 to 6, while the y-axis represents the AUROC score, ranging from 0.6 to 1.
### Components/Axes
* **Title:** AUROC vs. Number Explanations
* **X-axis:** Number Explanations, with tick marks at 0, 1, 2, 3, 4, 5, and 6.
* **Y-axis:** AUROC, with tick marks at 0.6, 0.65, 0.7, 0.75, 0.8, 0.85, 0.9, 0.95, and 1.
* **Legend:** Located at the bottom of the chart, it identifies the datasets by color:
* Blue: CSQA
* Orange: TruthQA
* Gray: MedQA
* Yellow: MMLU Law
* Light Blue: MMLU Physics
### Detailed Analysis
* **CSQA (Blue):** Starts at approximately 0.76 AUROC with 1 explanation, increases to approximately 0.78 with 3 explanations, and ends at approximately 0.79 with 5 explanations. The trend is slightly upward.
* **TruthQA (Orange):** Starts at approximately 0.83 AUROC with 1 explanation, remains relatively stable at approximately 0.83 with 3 explanations, and increases to approximately 0.85 with 5 explanations. The trend is slightly upward.
* **MedQA (Gray):** Starts at approximately 0.76 AUROC with 1 explanation, increases to approximately 0.80 with 3 explanations, and decreases to approximately 0.79 with 5 explanations. The trend is relatively flat.
* **MMLU Law (Yellow):** Starts at approximately 0.70 AUROC with 1 explanation, increases to approximately 0.75 with 3 explanations, and ends at approximately 0.78 with 5 explanations. The trend is upward.
* **MMLU Physics (Light Blue):** Starts at approximately 0.76 AUROC with 1 explanation, increases to approximately 0.78 with 3 explanations, and ends at approximately 0.79 with 5 explanations. The trend is slightly upward.
### Key Observations
* TruthQA consistently has the highest AUROC scores across all numbers of explanations.
* MMLU Law generally has the lowest AUROC scores.
* The AUROC scores for all datasets tend to increase slightly as the number of explanations increases from 1 to 5.
* MedQA shows a slight decrease in AUROC from 3 to 5 explanations.
### Interpretation
The chart suggests that increasing the number of explanations generally leads to a slight improvement in AUROC scores for the datasets analyzed. However, the effect is not uniform across all datasets, as seen with MedQA, which shows a slight decrease in performance with more explanations. TruthQA consistently outperforms the other datasets, indicating it may be more robust or better suited to the explanation methods used. The relatively small changes in AUROC with increasing explanations suggest that the number of explanations is not the sole determinant of model performance, and other factors such as the quality or relevance of the explanations may play a more significant role.