\n
## Line Chart: AUROC vs. Number Explanations
### Overview
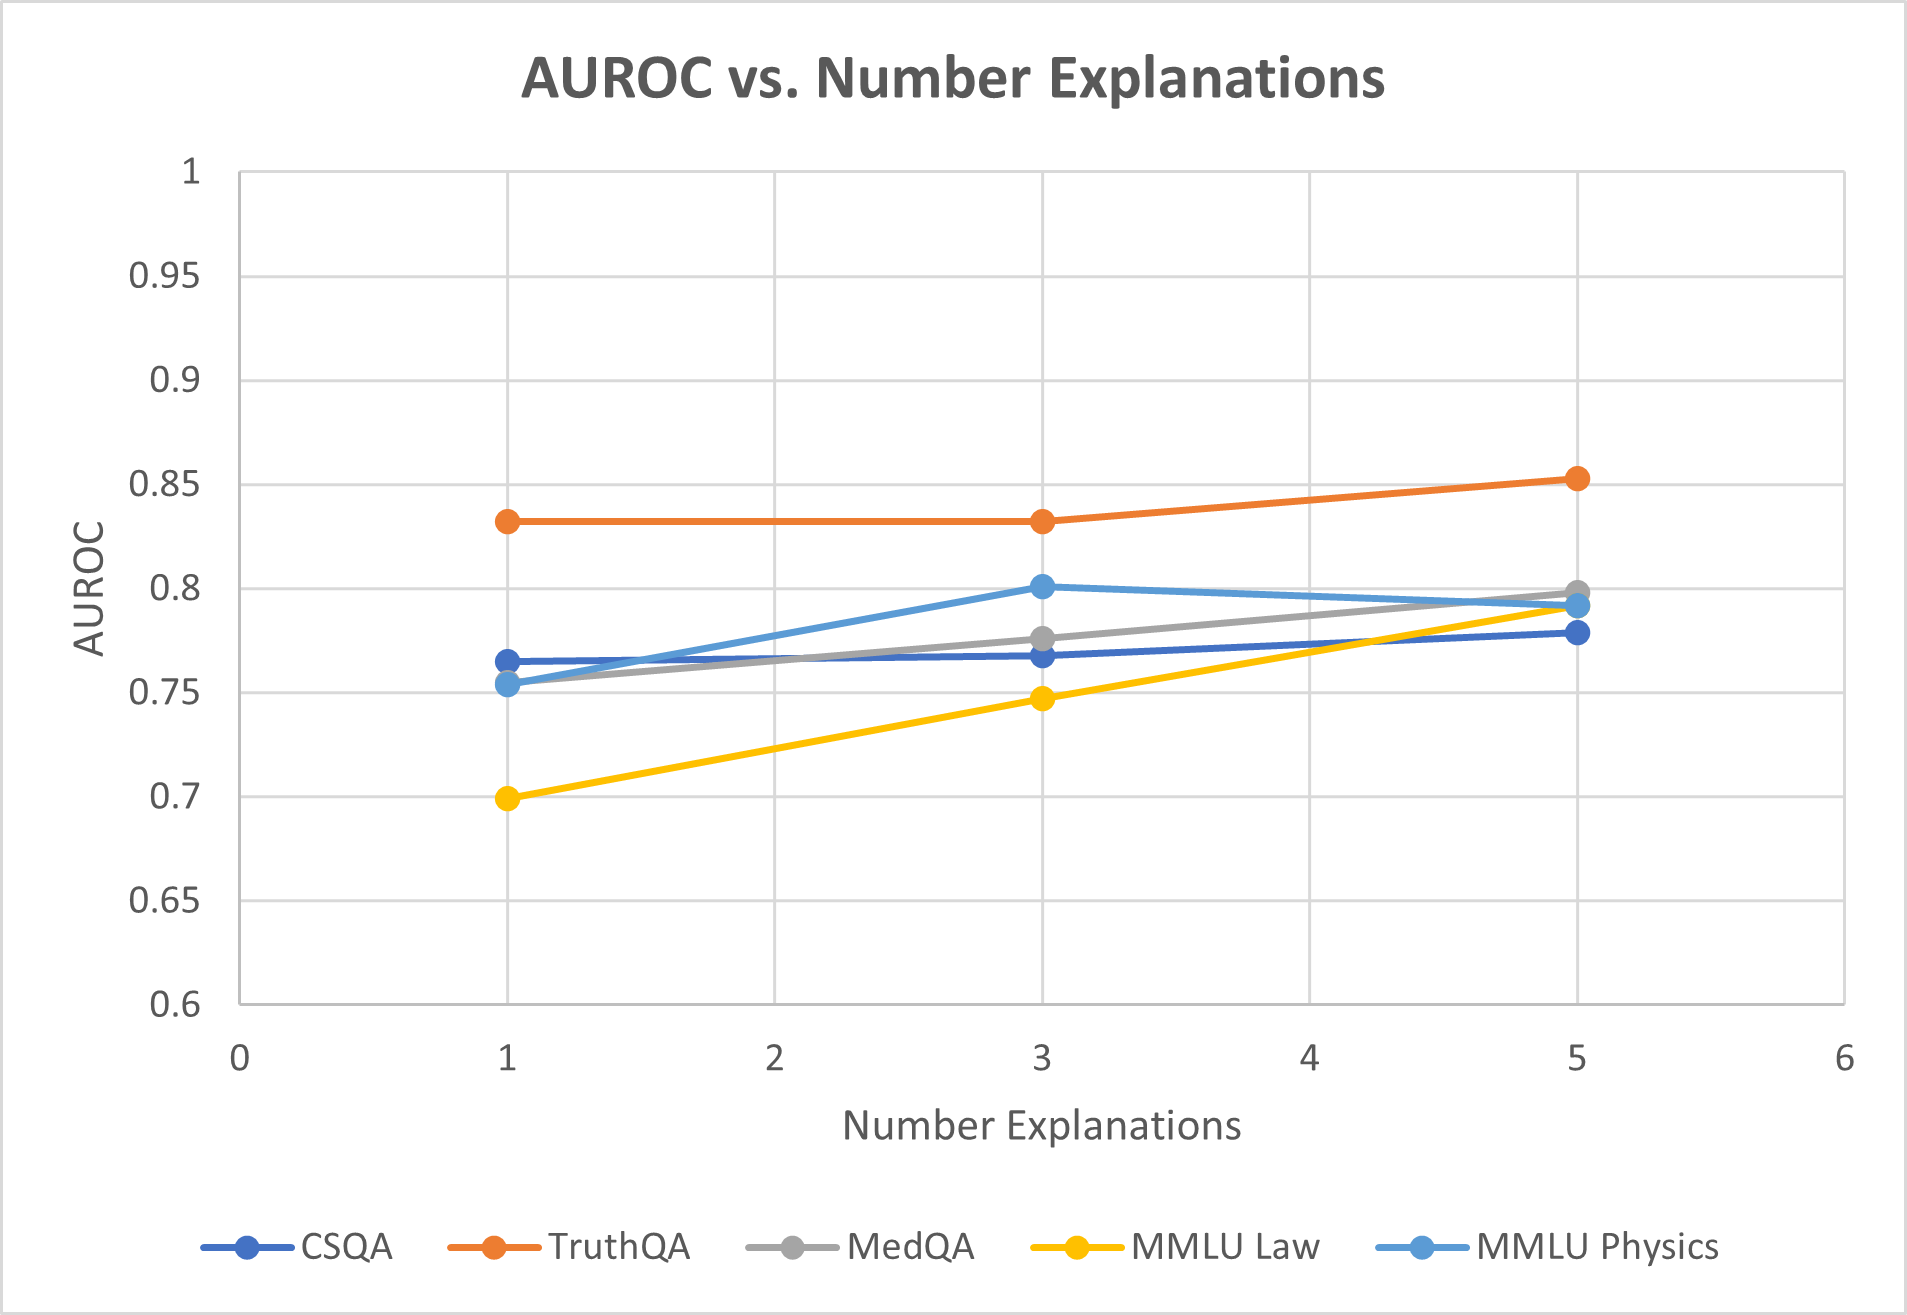
This line chart depicts the relationship between the Area Under the Receiver Operating Characteristic curve (AUROC) and the number of explanations provided, for five different question answering datasets. The x-axis represents the number of explanations, ranging from 0 to 6. The y-axis represents the AUROC score, ranging from 0.6 to 1.0. Five distinct lines represent the AUROC scores for each dataset as the number of explanations increases.
### Components/Axes
* **Title:** AUROC vs. Number Explanations
* **X-axis Label:** Number Explanations (Scale: 0, 1, 2, 3, 4, 5, 6)
* **Y-axis Label:** AUROC (Scale: 0.6, 0.65, 0.7, 0.75, 0.8, 0.85, 0.9, 0.95, 1.0)
* **Legend:** Located at the bottom-center of the chart.
* CSQA (Blue)
* TruthQA (Gray)
* MedQA (Light Gray)
* MMLU Law (Orange)
* MMLU Physics (Teal)
### Detailed Analysis
The chart displays five lines, each representing a different dataset's AUROC score as the number of explanations increases.
* **CSQA (Blue):** The line starts at approximately 0.73 at 1 explanation, rises to approximately 0.78 at 3 explanations, and then plateaus around 0.78-0.80 for 4 and 5 explanations.
* **TruthQA (Gray):** The line begins at approximately 0.75 at 1 explanation, increases to approximately 0.79 at 3 explanations, and then decreases slightly to approximately 0.78 at 5 explanations.
* **MedQA (Light Gray):** The line starts at approximately 0.78 at 1 explanation, increases to approximately 0.81 at 3 explanations, and then remains relatively stable around 0.80-0.82 for 4 and 5 explanations.
* **MMLU Law (Orange):** The line starts at approximately 0.69 at 1 explanation, increases steadily to approximately 0.85 at 5 explanations. This line shows the most significant positive trend.
* **MMLU Physics (Teal):** The line begins at approximately 0.79 at 1 explanation, decreases slightly to approximately 0.78 at 3 explanations, and then increases to approximately 0.80 at 5 explanations.
### Key Observations
* MMLU Law demonstrates the most substantial improvement in AUROC score as the number of explanations increases.
* CSQA, TruthQA, and MedQA show relatively stable AUROC scores after 3 explanations.
* MMLU Physics exhibits a slight initial decrease in AUROC score before stabilizing and increasing.
* All datasets show an initial increase in AUROC score with the addition of explanations, suggesting that explanations generally improve model performance.
### Interpretation
The data suggests that providing explanations alongside question-answering models can improve their performance, as measured by AUROC. The degree of improvement varies significantly depending on the dataset. MMLU Law benefits the most from explanations, indicating that this dataset may be particularly sensitive to the reasoning provided. The other datasets show diminishing returns with additional explanations, suggesting that there is a point at which adding more explanations does not significantly improve performance. The initial dip in MMLU Physics could be due to the explanations being initially unhelpful or even misleading, before the model learns to effectively utilize them. This chart highlights the importance of considering the specific characteristics of a dataset when evaluating the effectiveness of explanation-based methods. The consistent upward trend for MMLU Law suggests that this dataset may benefit from more complex or detailed explanations.