## Line Chart: AUROC vs. Number Explanations
### Overview
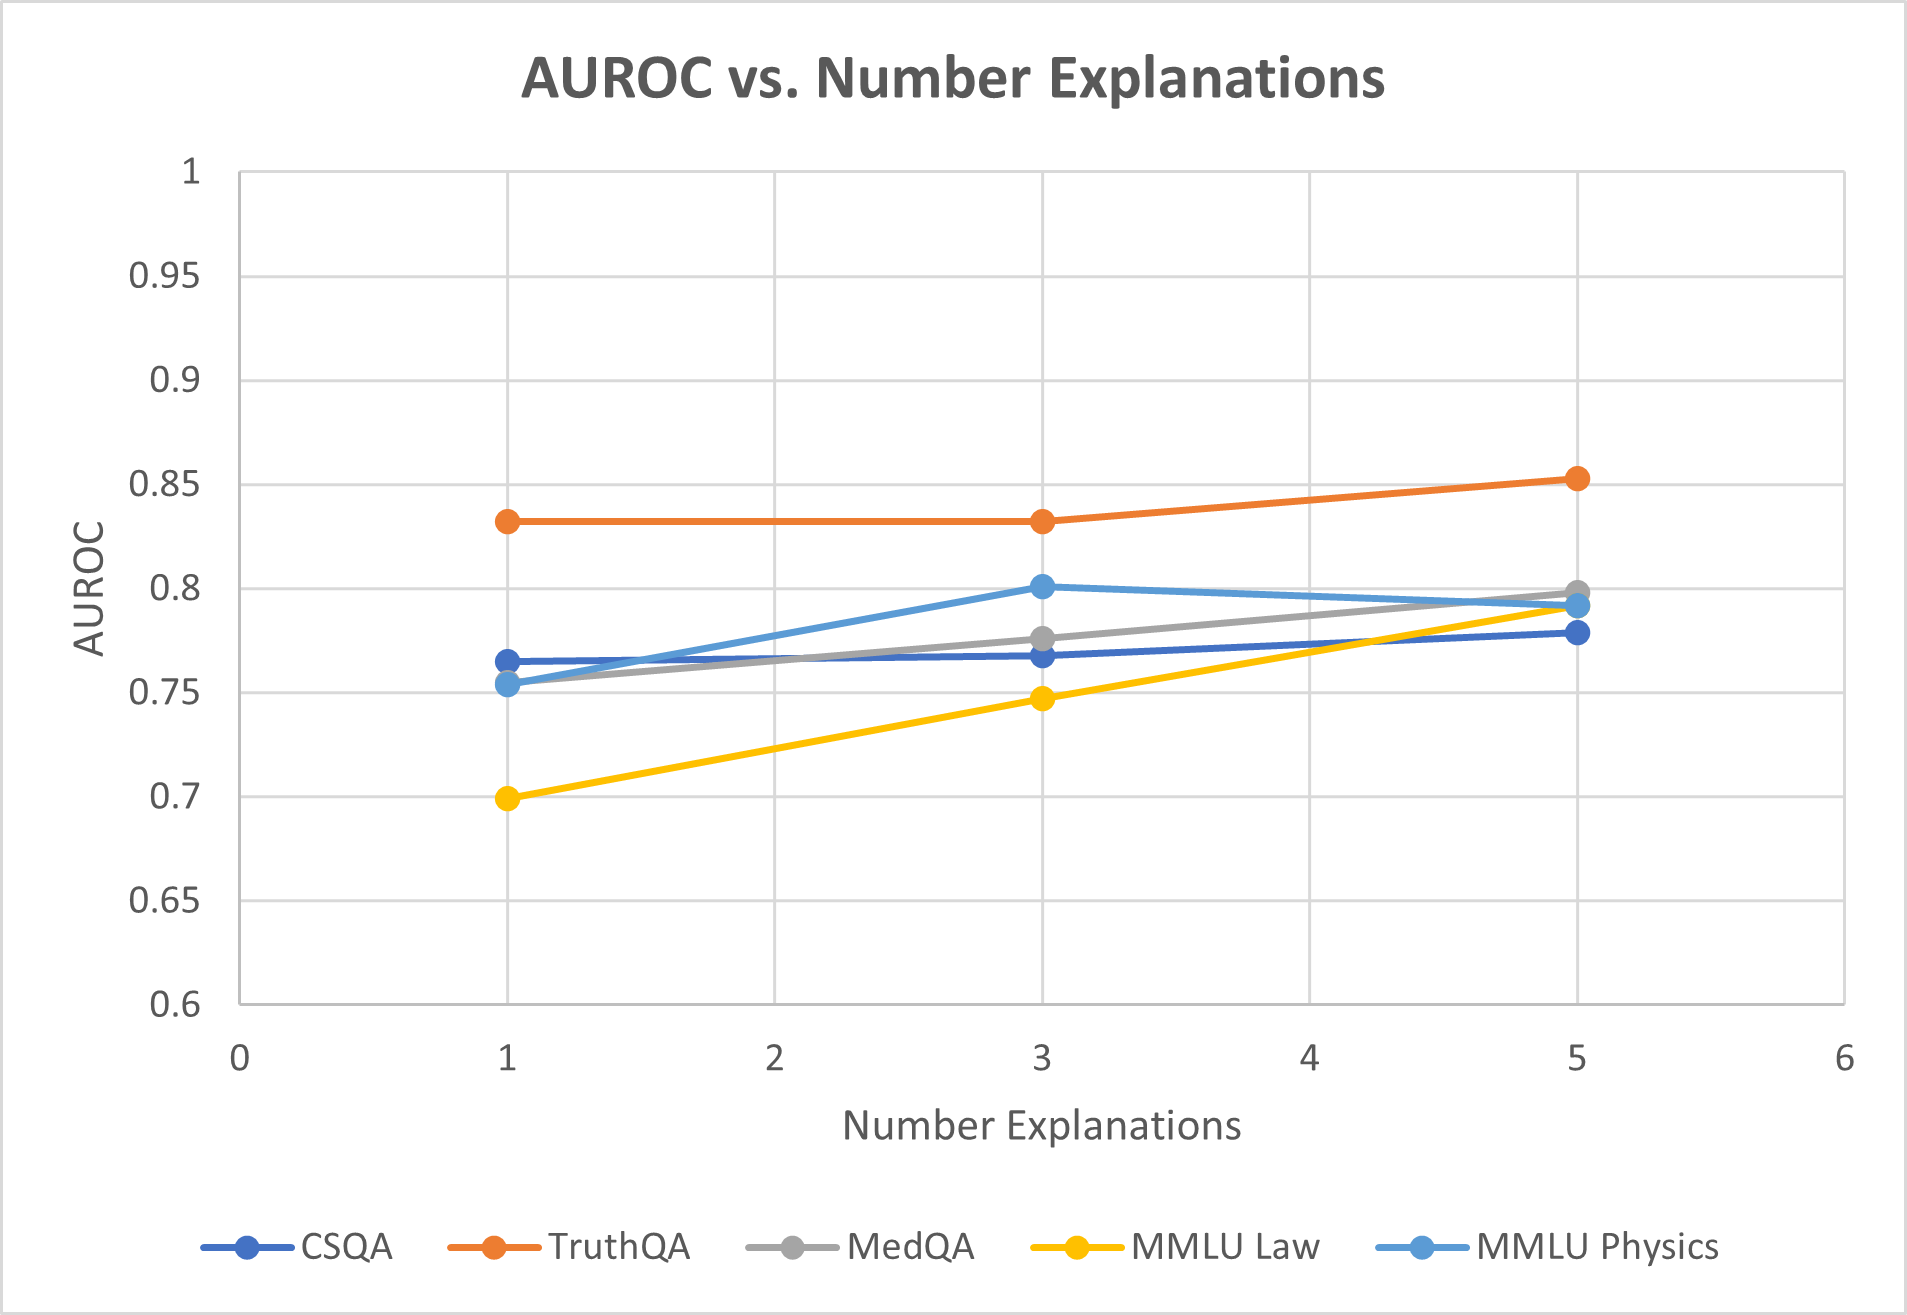
The chart compares the performance of five models (CSQA, TruthQA, MedQA, MMLU Law, MMLU Physics) in terms of Area Under the Receiver Operating Characteristic Curve (AUROC) across different numbers of explanations (1, 3, 5). AUROC values range from 0.6 to 1, with higher values indicating better performance. The x-axis represents the number of explanations, and the y-axis represents AUROC scores.
### Components/Axes
- **X-axis**: "Number Explanations" (0–6, with data points at 1, 3, 5).
- **Y-axis**: "AUROC" (0.6–1, in increments of 0.05).
- **Legend**: Located at the bottom, mapping colors to models:
- Blue: CSQA
- Orange: TruthQA
- Gray: MedQA
- Yellow: MMLU Law
- Light Blue: MMLU Physics
### Detailed Analysis
1. **CSQA (Blue)**:
- At 1 explanation: ~0.76 AUROC.
- At 3 explanations: ~0.77 AUROC.
- At 5 explanations: ~0.78 AUROC.
- **Trend**: Slight upward slope, then plateau.
2. **TruthQA (Orange)**:
- Constant at ~0.83 AUROC across all explanations.
- **Trend**: Flat line, no variation.
3. **MedQA (Gray)**:
- At 1 explanation: ~0.76 AUROC.
- At 3 explanations: ~0.78 AUROC.
- At 5 explanations: ~0.80 AUROC.
- **Trend**: Gradual upward slope.
4. **MMLU Law (Yellow)**:
- At 1 explanation: ~0.70 AUROC.
- At 3 explanations: ~0.75 AUROC.
- At 5 explanations: ~0.79 AUROC.
- **Trend**: Steep upward slope, then slight plateau.
5. **MMLU Physics (Light Blue)**:
- At 1 explanation: ~0.75 AUROC.
- At 3 explanations: ~0.80 AUROC.
- At 5 explanations: ~0.79 AUROC.
- **Trend**: Sharp initial increase, then slight decline.
### Key Observations
- **TruthQA** consistently achieves the highest AUROC (~0.83), outperforming all other models.
- **MMLU Law** shows the most significant improvement with more explanations, rising from 0.70 to 0.79.
- **MMLU Physics** peaks at 3 explanations (~0.80) but slightly declines at 5 explanations.
- **CSQA** and **MedQA** exhibit modest gains, with MedQA showing the most consistent improvement.
### Interpretation
The data suggests that increasing the number of explanations generally improves model performance (AUROC), but with diminishing returns for some models. **TruthQA** remains the most robust, maintaining a high AUROC regardless of explanation count. **MMLU Law** benefits disproportionately from additional explanations, indicating it may rely on contextual reasoning that improves with more input. The slight decline in **MMLU Physics** at 5 explanations could signal overfitting or noise in the data. Overall, the chart highlights the trade-off between explanation quantity and model efficacy, with TruthQA as the outlier in stability and performance.