## Chart: Metric Value vs. Lambda (λ) for Different Time Points
### Overview
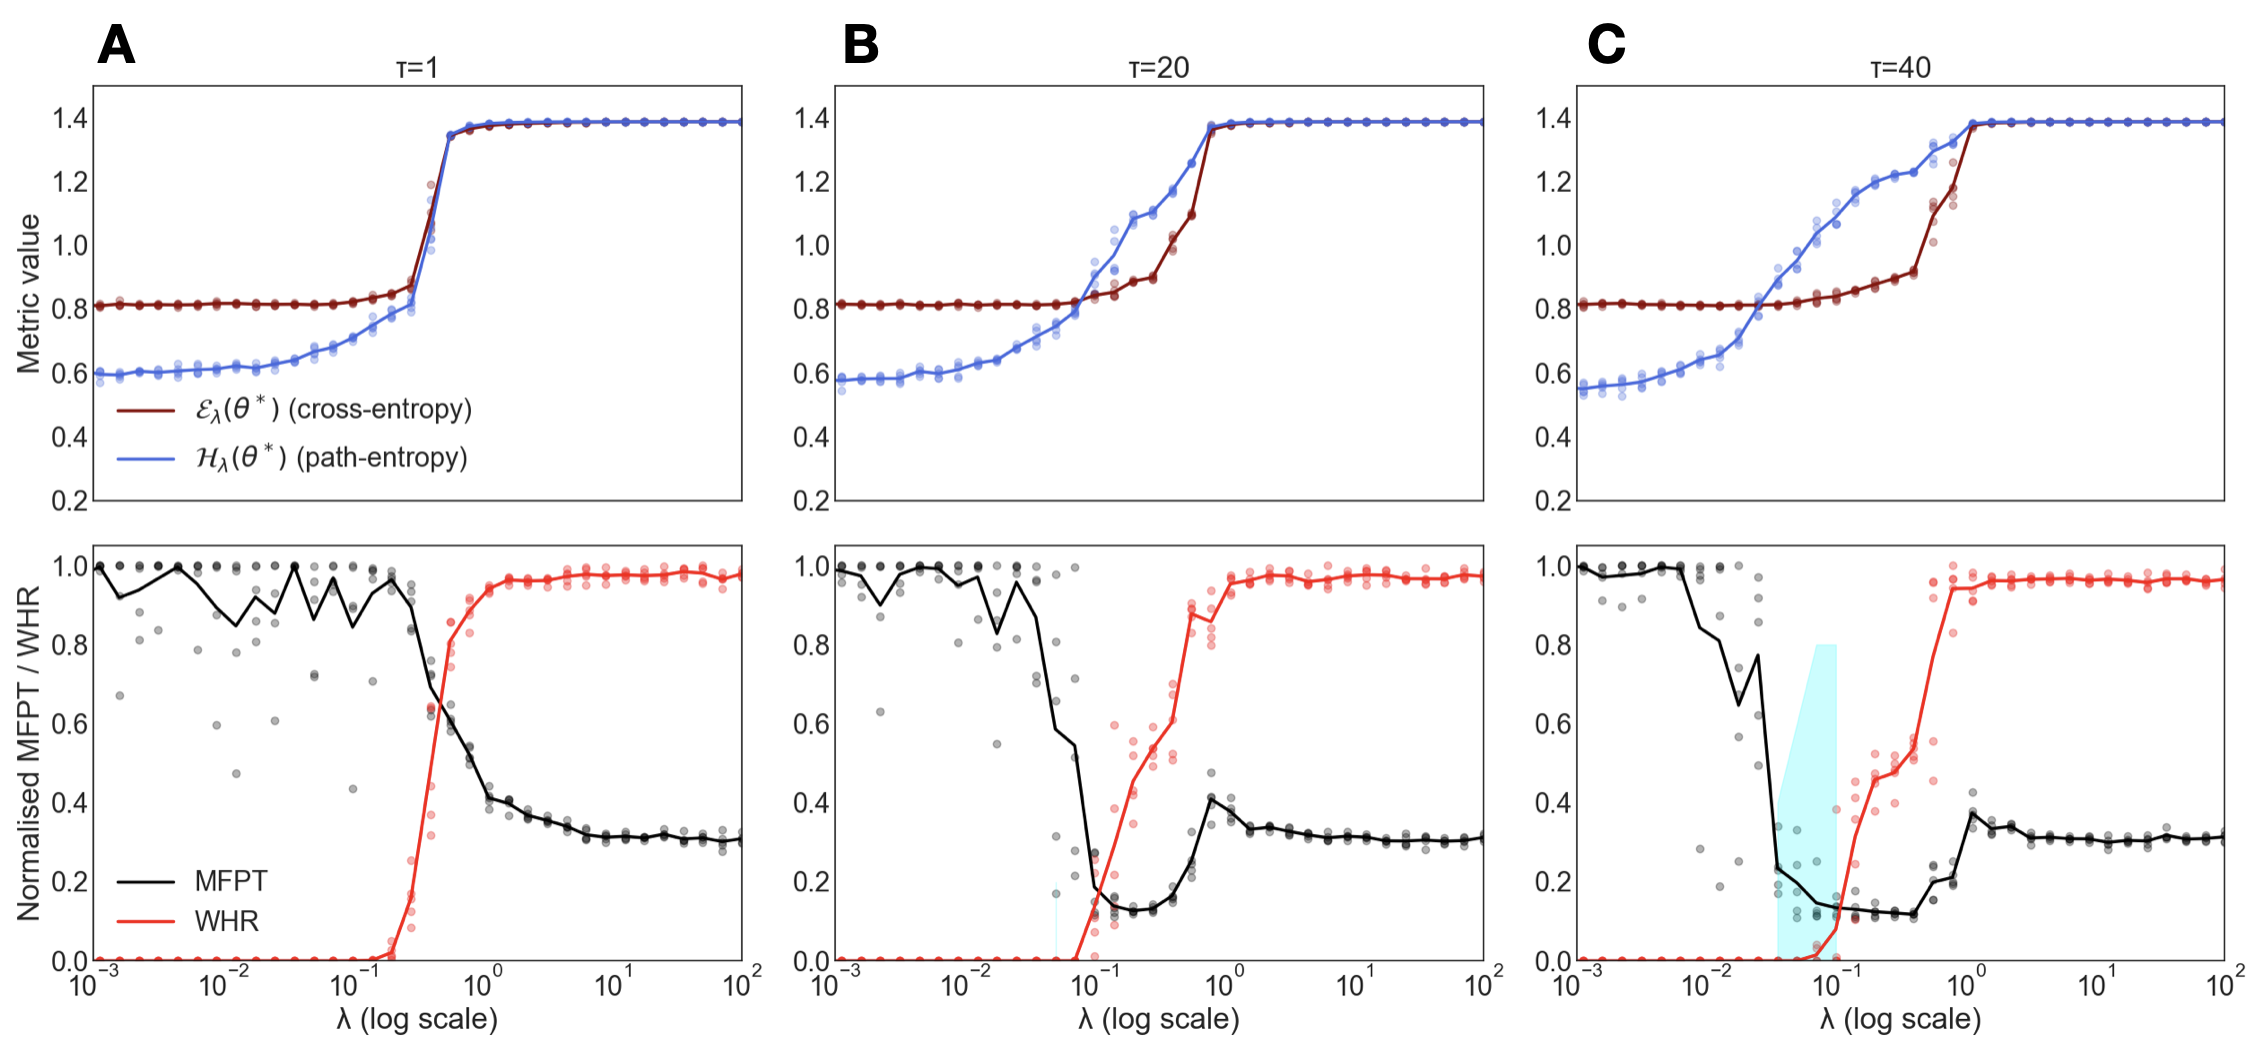
This image presents three charts (A, B, and C) displaying the relationship between a metric value (cross-entropy and path-entropy) and lambda (λ) on a logarithmic scale, for different time points (τ = 1, τ = 20, and τ = 40). The charts also show the normalized MFPT/WHR ratio against lambda. The charts appear to be investigating the behavior of these metrics as a parameter (λ) changes over time.
### Components/Axes
* **X-axis:** λ (Lambda) - Log Scale, ranging from 10<sup>-3</sup> to 10<sup>2</sup>.
* **Y-axis (Top):** Metric Value - ranging from 0.0 to 1.4. Two metrics are plotted: ε<sub>1</sub>(θ*) (cross-entropy) and H<sub>1</sub>(θ*) (path-entropy).
* **Y-axis (Bottom):** Normalized MFPT / WHR - ranging from 0.0 to 1.1.
* **Legend (Bottom-Left):**
* MFPT (teal/cyan) - represented by a solid line with markers.
* WHR (red) - represented by a solid line with markers.
* **Titles (Top):**
* A: τ = 1
* B: τ = 20
* C: τ = 40
### Detailed Analysis or Content Details
**Chart A (τ = 1):**
* **Cross-Entropy (ε<sub>1</sub>(θ*)):** (Blue) Starts at approximately 0.75, remains relatively stable until λ ≈ 10<sup>-1</sup>, then rapidly increases to approximately 1.35.
* **Path-Entropy (H<sub>1</sub>(θ*)):** (Light Blue) Starts at approximately 0.7, remains relatively stable until λ ≈ 10<sup>-1</sup>, then rapidly increases to approximately 1.3.
* **MFPT:** (Teal) Starts at approximately 0.9, decreases to a minimum of approximately 0.05 at λ ≈ 10<sup>-2</sup>, then increases to approximately 0.25 at λ = 10<sup>2</sup>.
* **WHR:** (Red) Starts at approximately 0.9, fluctuates with peaks around λ ≈ 10<sup>-2</sup> and 10<sup>-1</sup>, and ends at approximately 0.85.
**Chart B (τ = 20):**
* **Cross-Entropy (ε<sub>1</sub>(θ*)):** (Blue) Starts at approximately 0.75, remains relatively stable until λ ≈ 10<sup>-1</sup>, then rapidly increases to approximately 1.3.
* **Path-Entropy (H<sub>1</sub>(θ*)):** (Light Blue) Starts at approximately 0.7, remains relatively stable until λ ≈ 10<sup>-1</sup>, then rapidly increases to approximately 1.3.
* **MFPT:** (Teal) Starts at approximately 0.9, decreases to a minimum of approximately 0.2 at λ ≈ 10<sup>-2</sup>, then increases to approximately 0.6 at λ = 10<sup>2</sup>.
* **WHR:** (Red) Starts at approximately 1.0, decreases to a minimum of approximately 0.2 at λ ≈ 10<sup>-2</sup>, then increases to approximately 0.8 at λ = 10<sup>2</sup>.
**Chart C (τ = 40):**
* **Cross-Entropy (ε<sub>1</sub>(θ*)):** (Blue) Starts at approximately 0.75, remains relatively stable until λ ≈ 10<sup>-1</sup>, then rapidly increases to approximately 1.3.
* **Path-Entropy (H<sub>1</sub>(θ*)):** (Light Blue) Starts at approximately 0.7, remains relatively stable until λ ≈ 10<sup>-1</sup>, then rapidly increases to approximately 1.3.
* **MFPT:** (Teal) Starts at approximately 0.9, decreases to a minimum of approximately 0.1 at λ ≈ 10<sup>-2</sup>, then increases to approximately 0.7 at λ = 10<sup>2</sup>.
* **WHR:** (Red) Starts at approximately 1.0, decreases to a minimum of approximately 0.1 at λ ≈ 10<sup>-2</sup>, then increases to approximately 0.8 at λ = 10<sup>2</sup>.
### Key Observations
* The cross-entropy and path-entropy curves are nearly identical across all three time points. They exhibit a step-like increase at approximately λ = 10<sup>-1</sup>.
* Both MFPT and WHR show a similar trend across all time points: a decrease to a minimum around λ = 10<sup>-2</sup>, followed by an increase.
* The minimum values of MFPT and WHR appear to decrease as time (τ) increases. The dip is more pronounced at τ = 40.
* The WHR curve exhibits more fluctuations than the MFPT curve, particularly at lower values of λ.
### Interpretation
The charts suggest that the cross-entropy and path-entropy metrics reach a threshold at a specific value of lambda (around 10<sup>-1</sup>), indicating a change in the system's state or behavior. The normalized MFPT/WHR ratio appears to be sensitive to changes in lambda, with a minimum value indicating an optimal or critical point.
The decreasing minimum values of MFPT and WHR with increasing time (τ) suggest that the system is becoming more efficient or optimized over time. The fluctuations in the WHR curve might indicate a higher degree of variability or sensitivity to changes in the system.
The relationship between these metrics and lambda could be related to a parameter controlling the exploration-exploitation trade-off in a reinforcement learning or optimization context. The time parameter (τ) likely represents the number of iterations or steps taken in the process. The data suggests that as the process continues (increasing τ), the system converges towards a more optimal state, as reflected by the lower MFPT and WHR values. The sharp increase in entropy metrics at a certain lambda value could indicate a phase transition or a point of instability.