## Multi-Panel Line Chart: Metric and Performance Analysis Across Lambda (λ) and Tau (τ)
### Overview
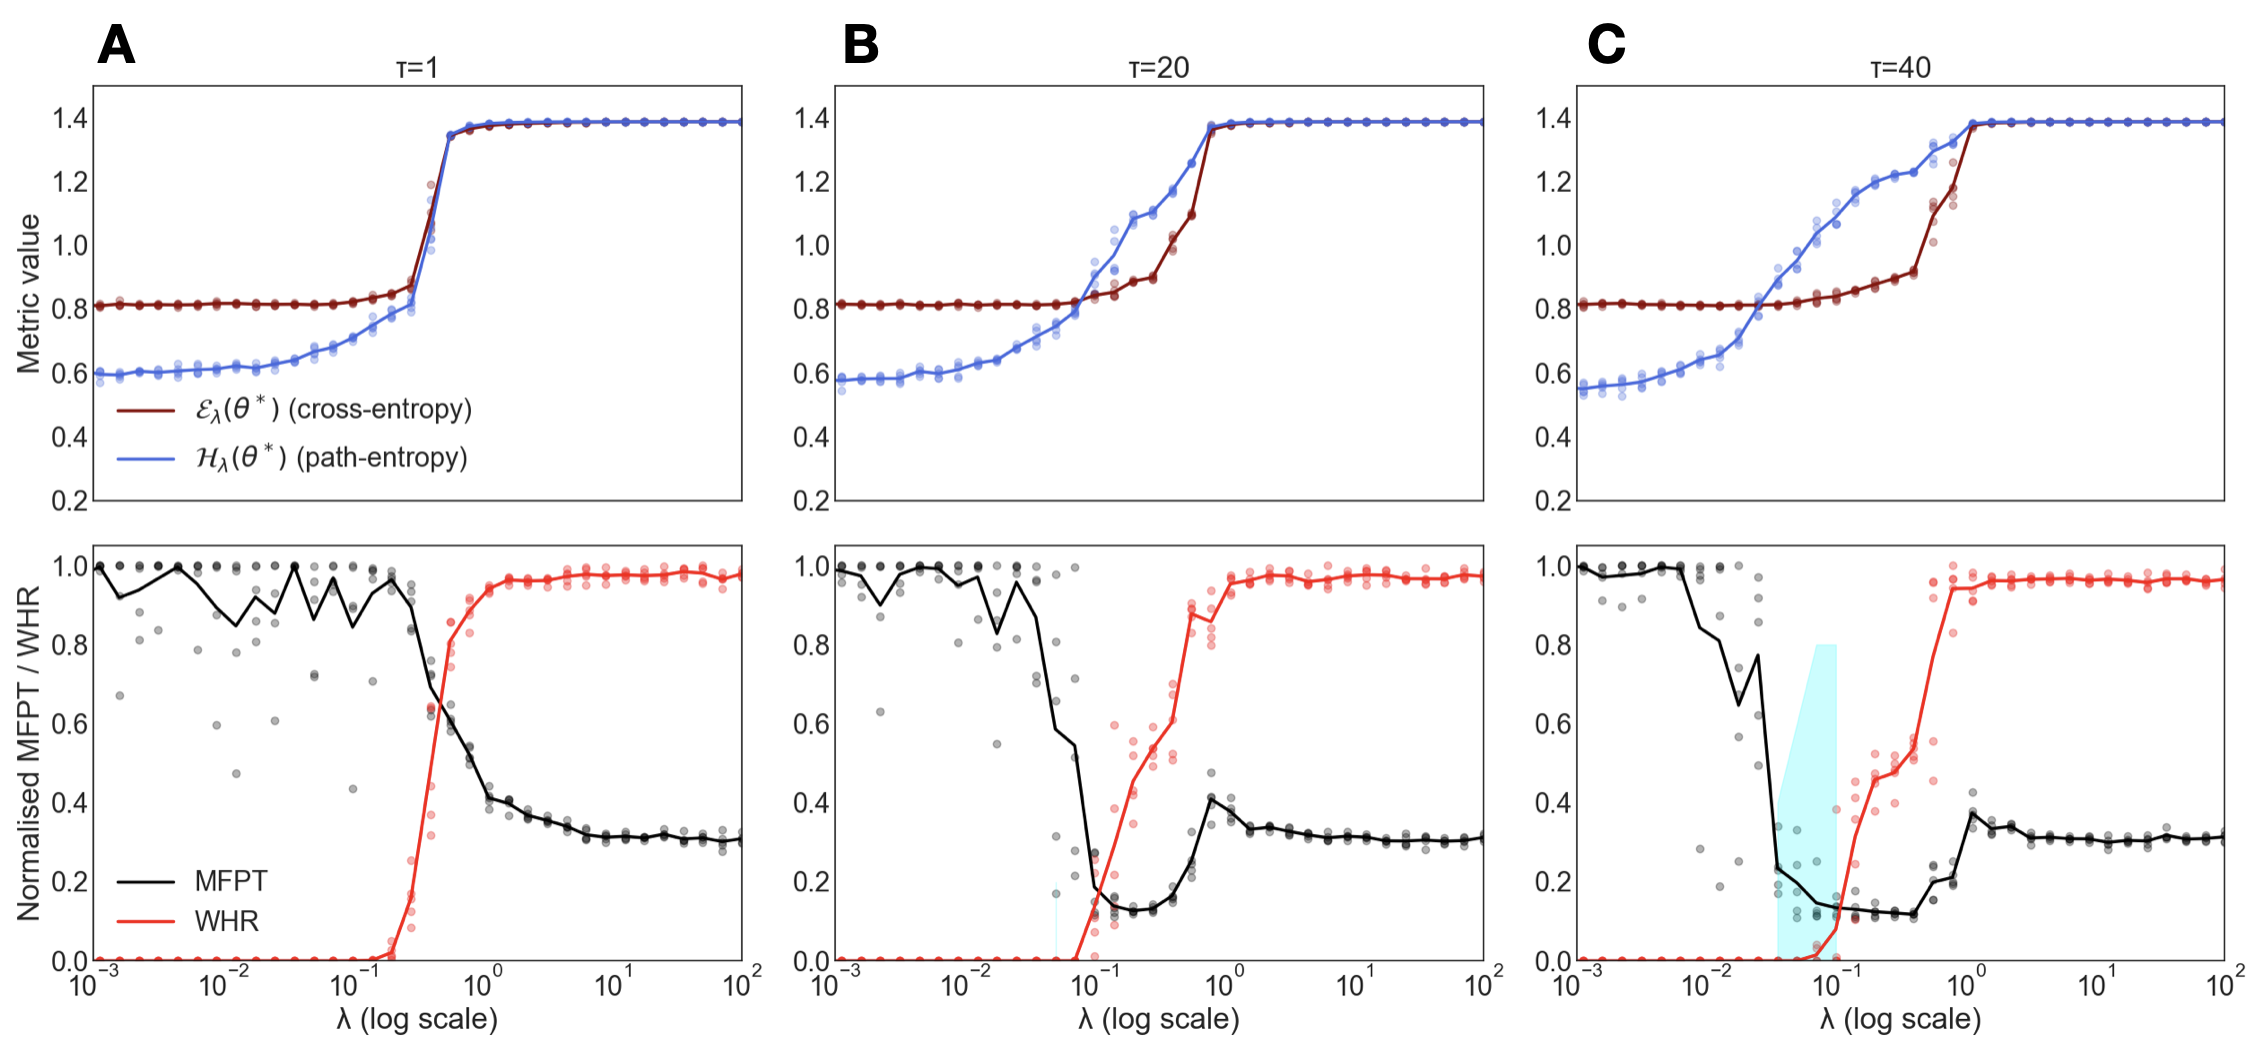
The image displays a composite figure containing six line charts arranged in a 2x3 grid. The three columns (A, B, C) correspond to different values of a parameter τ (tau): τ=1, τ=20, and τ=40. The top row of charts plots two entropy-based metrics against λ (lambda), while the bottom row plots two normalized performance metrics against the same λ. The x-axis for all charts is λ on a logarithmic scale.
### Components/Axes
* **Panels:** Three main vertical panels labeled **A**, **B**, and **C** at the top-left of each column.
* **Top Row Charts:**
* **Y-axis:** Label is "Metric value". Scale ranges from 0.2 to 1.4.
* **X-axis:** Shared with the bottom chart in each panel. Label is "λ (log scale)". Scale is logarithmic, with major ticks at 10⁻³, 10⁻², 10⁻¹, 10⁰, 10¹, 10².
* **Legend (Top-Left):** Contains two entries.
* Red line: `E_λ(θ*) (cross-entropy)`
* Blue line: `H_λ(θ*) (path-entropy)`
* **Bottom Row Charts:**
* **Y-axis:** Label is "Normalised MFPT / WHR". Scale ranges from 0.0 to 1.0.
* **X-axis:** Identical to the top row. Label is "λ (log scale)".
* **Legend (Bottom-Left):** Contains two entries.
* Black line: `MFPT`
* Red line: `WHR`
* **Data Representation:** Each chart shows a solid line (likely a mean or trend) overlaid on a scatter of semi-transparent data points (gray for MFPT, light red for WHR, light blue for path-entropy, light red for cross-entropy).
### Detailed Analysis
**Panel A (τ=1):**
* **Top Chart:** Both `E_λ(θ*)` (red) and `H_λ(θ*)` (blue) start at low values (~0.8 and ~0.6 respectively) for small λ. They exhibit a sharp, simultaneous increase between λ ≈ 10⁻¹ and λ ≈ 10⁰, plateauing together at a value of approximately 1.4 for λ > 10⁰.
* **Bottom Chart:** `MFPT` (black) starts high (~1.0) and fluctuates before beginning a steady decline around λ ≈ 10⁻¹, settling near 0.3 for λ > 10⁰. `WHR` (red) starts at 0, begins a sharp increase around λ ≈ 10⁻¹, and plateaus near 1.0 for λ > 10⁰. The crossover point where `WHR` surpasses `MFPT` is near λ ≈ 10⁻⁰·⁵ (~0.3).
**Panel B (τ=20):**
* **Top Chart:** The increase in both entropy metrics is more gradual and staggered compared to Panel A. `H_λ(θ*)` (blue) begins rising earlier (around λ ≈ 10⁻²) and leads `E_λ(θ*)` (red) through the transition. They converge to the same plateau (~1.4) around λ ≈ 10⁰.
* **Bottom Chart:** The decline of `MFPT` and rise of `WHR` are also more gradual. The `MFPT` curve shows a distinct dip and partial recovery between λ ≈ 10⁻¹ and λ ≈ 10⁰ before settling. The crossover occurs slightly later than in Panel A, near λ ≈ 10⁻⁰·³ (~0.5).
**Panel C (τ=40):**
* **Top Chart:** The separation between the two entropy curves is most pronounced. `H_λ(θ*)` (blue) rises steadily from λ ≈ 10⁻², while `E_λ(θ*)` (red) remains flat until λ ≈ 10⁻¹ before rising steeply to meet the blue line at the plateau (~1.4) near λ ≈ 10⁰·⁵ (~3).
* **Bottom Chart:** The trends are similar to Panel B but stretched. A notable feature is a light blue shaded vertical region between approximately λ ≈ 10⁻¹·⁵ and λ ≈ 10⁻⁰·⁵ (0.03 to 0.3). Within this region, `MFPT` drops sharply and `WHR` begins its ascent. The crossover point is near λ ≈ 10⁻⁰·² (~0.6).
### Key Observations
1. **Consistent Plateaus:** In all top charts, both entropy metrics converge to the same maximum value (~1.4) for sufficiently large λ.
2. **Inverse Relationship:** In all bottom charts, `MFPT` and `WHR` exhibit an inverse relationship; as one increases, the other decreases.
3. **Effect of τ:** Increasing τ (from A to C) delays and smoothens the transition region for all metrics. The "activation" of the metrics shifts to higher values of λ.
4. **Transition Sharpness:** The transition is sharpest for τ=1 (Panel A) and becomes progressively more gradual for τ=20 and τ=40.
5. **Data Variability:** The scatter of data points is most pronounced in the transition regions, indicating higher variance in system behavior during the phase change.
### Interpretation
This figure likely illustrates the behavior of a stochastic or machine learning system under varying regularization strength (λ) and a time-scale or temperature parameter (τ).
* **Entropy Metrics (Top Row):** The increase in both cross-entropy and path-entropy with λ suggests that stronger regularization (higher λ) leads to more exploratory or higher-entropy solutions in the parameter space (θ*). The path-entropy (`H_λ`) appears to be a leading indicator, responding to λ earlier than the cross-entropy (`E_λ`), especially at higher τ.
* **Performance Metrics (Bottom Row):** The inverse relationship between Mean First Passage Time (MFPT) and what is likely a Weighted Hitting Rate (WHR) indicates a trade-off. As λ increases, the system finds its target state faster (lower MFPT) and more reliably (higher WHR). This is the desired effect of the regularization.
* **Role of τ:** The parameter τ controls the "inertia" or timescale of the system. A higher τ makes the system less sensitive to small λ, requiring a stronger regularization force (higher λ) to push it out of its initial state and into the high-entropy, high-performance regime. The shaded region in Panel C highlights a critical window of λ where this transition is initiated for a high-τ system.
* **Overall Narrative:** The data demonstrates a **regularization-induced phase transition**. Below a critical λ, the system is in a low-entropy, high-MFPT, low-WHR state. Above this critical λ, it transitions to a high-entropy, low-MFPT, high-WHR state. The parameter τ modulates the sharpness and location of this transition. The alignment of the entropy increase with the performance improvement suggests that the exploration encouraged by regularization is directly responsible for the enhanced efficiency in reaching the target.