## Composite Plot: Cross-Entropy, Path-Entropy, MFPT, and WHR Metrics Across τ Values
### Overview
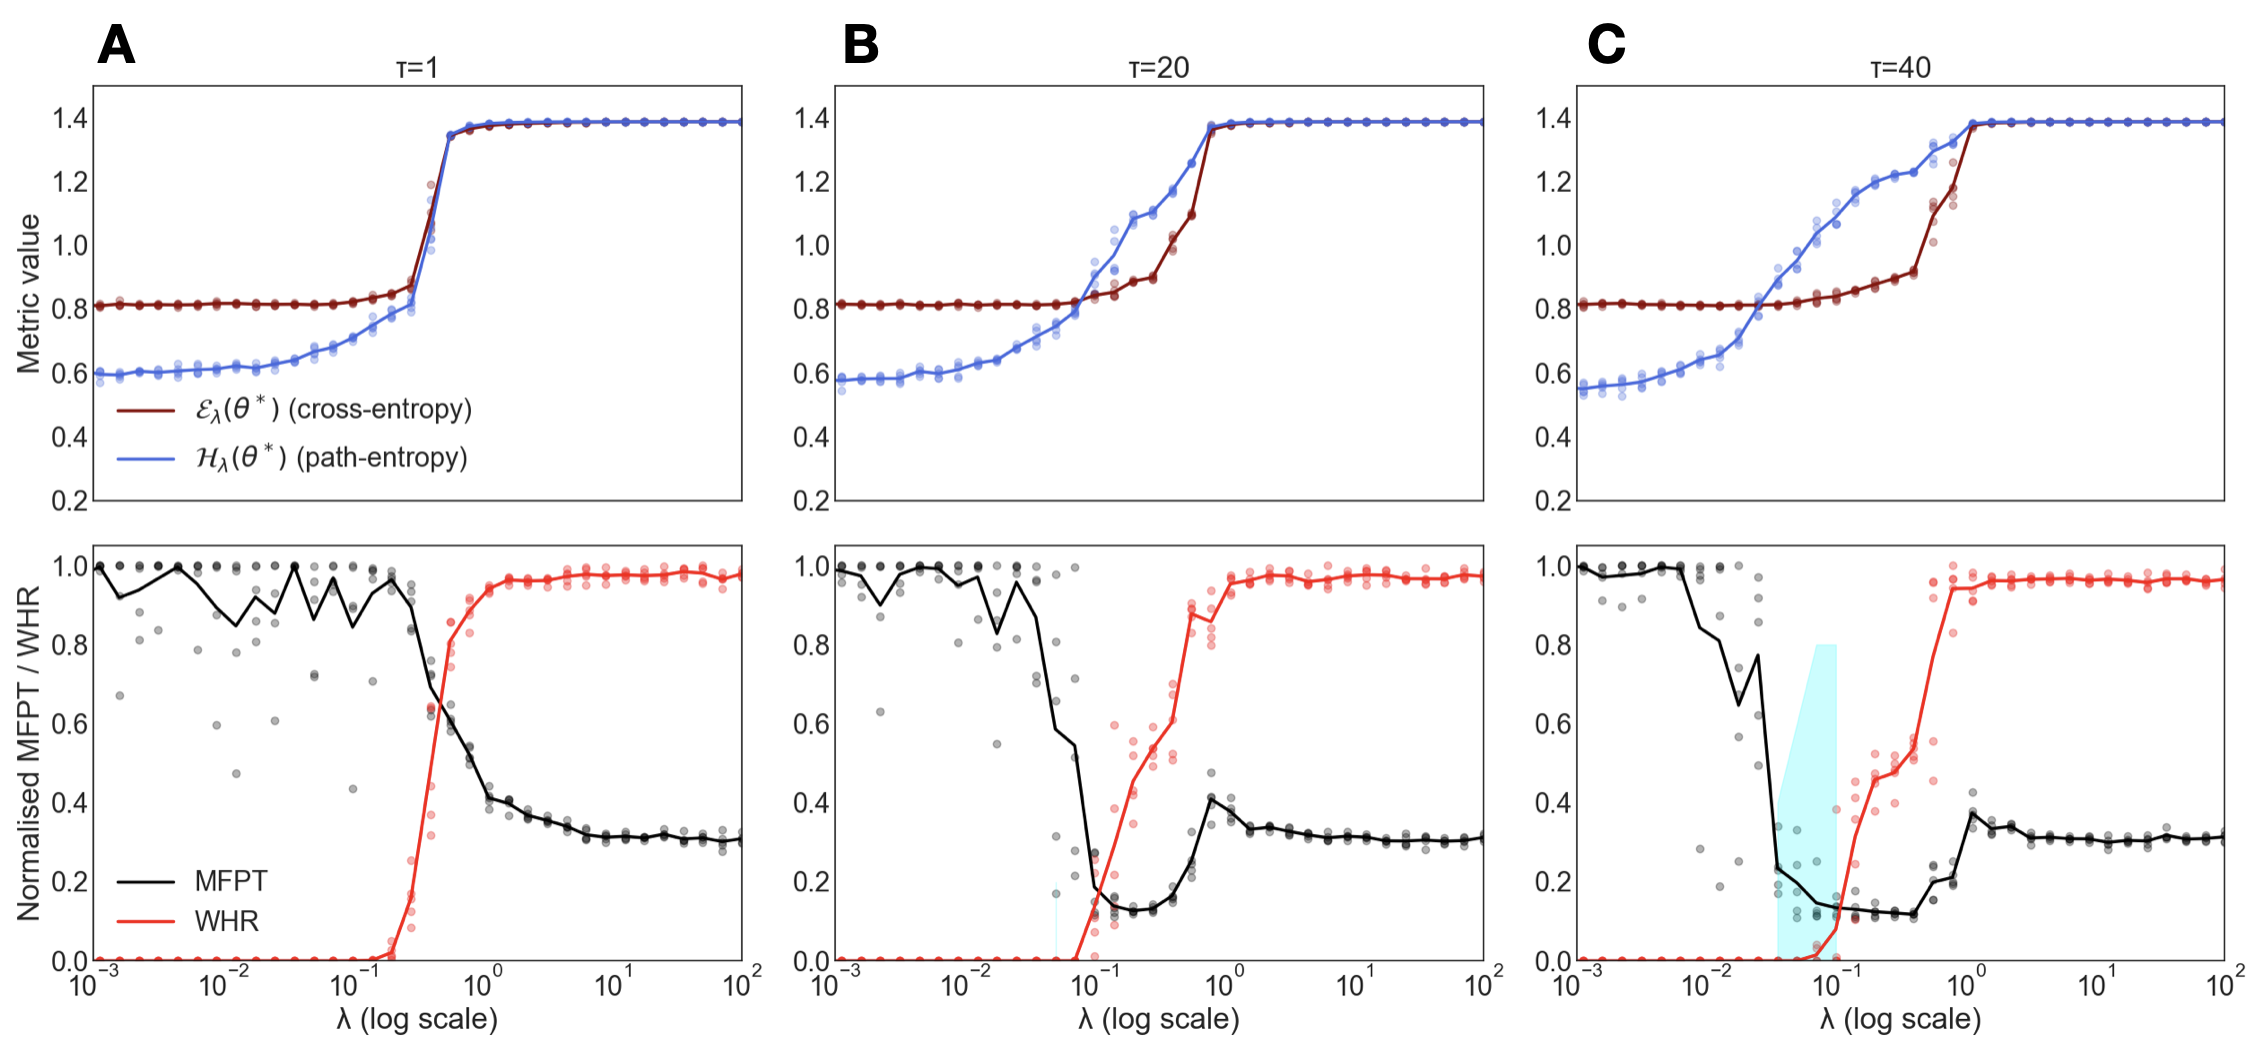
The image contains six panels (A-C, top and bottom rows) comparing metrics across three τ values (1, 20, 40). Each panel includes:
- **Top row**: Cross-entropy (Eλ(θ*)) and path-entropy (Hλ(θ*)) vs. λ (log scale).
- **Bottom row**: Normalized MFPT/WHR vs. λ (log scale).
- **Legends**: Red for cross-entropy, blue for path-entropy (top row); black for MFPT, red for WHR (bottom row).
- **Shaded region**: Blue area in panel C (τ=40) highlights a divergence region.
---
### Components/Axes
#### Top Row (Cross-Entropy & Path-Entropy)
- **X-axis**: λ (log scale, 10⁻³ to 10²).
- **Y-axis**: Metric value (0.2–1.4).
- **Legends**:
- Red: Eλ(θ*) (cross-entropy).
- Blue: Hλ(θ*) (path-entropy).
#### Bottom Row (MFPT & WHR)
- **X-axis**: λ (log scale, 10⁻³ to 10²).
- **Y-axis**: Normalized MFPT/WHR (0–1).
- **Legends**:
- Black: MFPT.
- Red: WHR.
- **Shaded region**: Blue area in panel C (τ=40, λ ≈ 10⁻¹ to 10⁰).
---
### Detailed Analysis
#### Top Row Trends
1. **τ=1 (Panel A)**:
- **Cross-entropy (red)**: Sharp rise from ~0.8 to 1.4 at λ ≈ 10⁻¹, then plateaus.
- **Path-entropy (blue)**: Gradual increase from ~0.6 to 1.4 at λ ≈ 10⁰, then plateaus.
2. **τ=20 (Panel B)**:
- **Cross-entropy (red)**: Slower rise to 1.4 at λ ≈ 10⁻⁰.⁵, then plateaus.
- **Path-entropy (blue)**: Gradual increase to 1.4 at λ ≈ 10⁰, then plateaus.
3. **τ=40 (Panel C)**:
- **Cross-entropy (red)**: Smooth rise to 1.4 at λ ≈ 10⁻⁰.⁵, then plateaus.
- **Path-entropy (blue)**: Gradual increase to 1.4 at λ ≈ 10⁰, then plateaus.
#### Bottom Row Trends
1. **MFPT (black)**:
- Sharp drop from ~1.0 to ~0.2 at λ ≈ 10⁻¹, then plateaus.
2. **WHR (red)**:
- Sharp rise from ~0.2 to ~1.0 at λ ≈ 10⁻¹, then plateaus.
3. **Shaded region (Panel C)**:
- Highlights λ ≈ 10⁻¹ to 10⁰, where MFPT and WHR diverge most.
---
### Key Observations
1. **Cross-Entropy vs. Path-Entropy**:
- Cross-entropy (red) rises more abruptly than path-entropy (blue) across all τ values.
- Higher τ values (e.g., τ=40) show smoother transitions in cross-entropy.
2. **MFPT vs. WHR**:
- Inverse relationship: MFPT decreases as WHR increases.
- Critical divergence at λ ≈ 10⁻¹ (shaded region in τ=40).
3. **τ Dependence**:
- Larger τ values (e.g., τ=40) show delayed but smoother metric transitions.
---
### Interpretation
1. **Metric Behavior**:
- Cross-entropy (Eλ) and path-entropy (Hλ) both increase with λ, but cross-entropy reflects sharper transitions, suggesting sensitivity to λ in early stages.
- MFPT (performance metric) and WHR (robustness/regularization metric) exhibit opposing trends, indicating a trade-off: higher λ improves robustness (WHR) but may reduce performance (MFPT).
2. **τ Impact**:
- Larger τ values (e.g., τ=40) suggest delayed convergence, with metrics stabilizing at higher λ thresholds.
3. **Shaded Region (Panel C)**:
- The blue area highlights a critical λ range (10⁻¹ to 10⁰) where MFPT and WHR diverge, potentially marking a phase transition or optimal λ window for balancing performance and robustness.
---
### Conclusion
The data demonstrates that λ and τ jointly influence metric behavior. Cross-entropy and path-entropy trends reflect model convergence dynamics, while MFPT and WHR reveal trade-offs between performance and regularization. The shaded region in τ=40 underscores a critical λ range for model optimization.