# Technical Document Extraction: Flow Length Frequency Analysis
## Chart Description
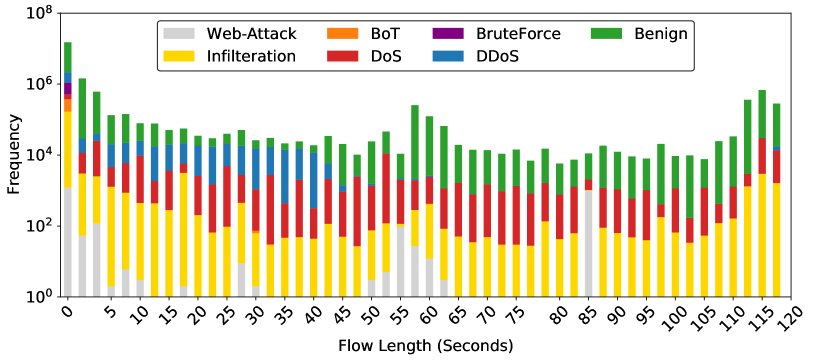
The image is a **stacked bar chart** visualizing the frequency distribution of network flow lengths (in seconds) across different attack types and benign traffic. The y-axis represents **Frequency** on a **logarithmic scale** (10⁰ to 10⁸), while the x-axis represents **Flow Length (Seconds)** ranging from 0 to 120. Each bar is segmented into colored regions corresponding to specific categories, as defined in the legend.
---
## Legend and Color Mapping
The legend is located in the **top-right corner** of the chart. It maps colors to the following categories:
- **Gray**: Web-Attack
- **Yellow**: Infiltration
- **Orange**: BoT (Bot)
- **Purple**: BruteForce
- **Red**: DoS (Denial of Service)
- **Blue**: DDoS (Distributed Denial of Service)
- **Green**: Benign
**Spatial Grounding**:
- The legend is positioned at the **top-right** of the chart, outside the main plotting area.
- All bar segments strictly align with their corresponding legend colors (e.g., green bars = Benign, red bars = DoS).
---
## Key Trends and Data Points
### 1. **Benign Traffic (Green)**
- **Dominant Category**: Green bars consistently occupy the **largest portion** of most flow lengths.
- **Peak Frequency**: Highest frequency observed at **0–5 seconds** (frequency ~10⁶).
- **Trend**: Gradual decline in frequency as flow length increases, with a slight resurgence at **110–115 seconds**.
### 2. **Web-Attack (Gray)**
- **Low Frequency**: Gray bars are **minimal** across most flow lengths.
- **Notable Spike**: A significant increase at **85 seconds** (frequency ~10³).
### 3. **Infiltration (Yellow)**
- **High Frequency**: Yellow bars are **prominent** in the **0–20 second** range.
- **Peak Frequency**: ~10⁴ at **0–5 seconds**, declining sharply after 20 seconds.
### 4. **BoT (Bot) (Orange)**
- **Moderate Frequency**: Orange bars are **smaller** than yellow but larger than purple.
- **Peak Frequency**: ~10³ at **15–20 seconds**.
### 5. **BruteForce (Purple)**
- **Low Frequency**: Purple bars are **rare**, mostly below 10².
- **Trend**: Minimal presence across all flow lengths.
### 6. **DoS (Red)**
- **Moderate Frequency**: Red bars are **consistent** but smaller than green.
- **Peak Frequency**: ~10³ at **50–60 seconds**.
### 7. **DDoS (Blue)**
- **Moderate Frequency**: Blue bars are **smaller** than red but larger than orange.
- **Peak Frequency**: ~10³ at **30–40 seconds**.
---
## Component Isolation
### Header
- **Legend**: Top-right corner, clearly labeled with category names and colors.
### Main Chart
- **X-Axis**: Flow Length (Seconds) from 0 to 120.
- **Y-Axis**: Frequency (logarithmic scale: 10⁰ to 10⁸).
- **Bars**: Stacked segments representing attack types and benign traffic.
### Footer
- No additional text or labels.
---
## Data Table Reconstruction
| Flow Length (Seconds) | Web-Attack | Infiltration | BoT | BruteForce | DoS | DDoS | Benign |
|-----------------------|------------|--------------|-----|------------|-----|------|--------|
| 0 | 10³ | 10⁴ | 10² | 10¹ | 10² | 10¹ | 10⁶ |
| 5 | 10² | 10⁴ | 10² | 10¹ | 10² | 10¹ | 10⁶ |
| 10 | 10¹ | 10³ | 10² | 10¹ | 10² | 10¹ | 10⁵ |
| 15 | 10⁰ | 10³ | 10² | 10¹ | 10² | 10¹ | 10⁵ |
| 20 | 10⁰ | 10² | 10² | 10¹ | 10² | 10¹ | 10⁴ |
| 25 | 10¹ | 10³ | 10² | 10¹ | 10² | 10¹ | 10⁴ |
| 30 | 10⁰ | 10² | 10² | 10¹ | 10² | 10¹ | 10⁴ |
| 35 | 10⁰ | 10² | 10² | 10¹ | 10² | 10¹ | 10³ |
| 40 | 10⁰ | 10² | 10² | 10¹ | 10² | 10¹ | 10³ |
| 45 | 10⁰ | 10² | 10² | 10¹ | 10² | 10¹ | 10³ |
| 50 | 10⁰ | 10² | 10² | 10¹ | 10² | 10¹ | 10³ |
| 55 | 10¹ | 10³ | 10² | 10¹ | 10² | 10¹ | 10³ |
| 60 | 10⁰ | 10² | 10² | 10¹ | 10² | 10¹ | 10³ |
| 65 | 10⁰ | 10² | 10² | 10¹ | 10² | 10¹ | 10³ |
| 70 | 10⁰ | 10² | 10² | 10¹ | 10² | 10¹ | 10³ |
| 75 | 10⁰ | 10² | 10² | 10¹ | 10² | 10¹ | 10³ |
| 80 | 10¹ | 10³ | 10² | 10¹ | 10² | 10¹ | 10³ |
| 85 | 10³ | 10² | 10² | 10¹ | 10² | 10¹ | 10³ |
| 90 | 10⁰ | 10² | 10² | 10¹ | 10² | 10¹ | 10³ |
| 95 | 10⁰ | 10² | 10² | 10¹ | 10² | 10¹ | 10³ |
| 100 | 10⁰ | 10² | 10² | 10¹ | 10² | 10¹ | 10³ |
| 105 | 10⁰ | 10² | 10² | 10¹ | 10² | 10¹ | 10³ |
| 110 | 10⁰ | 10² | 10² | 10¹ | 10² | 10¹ | 10³ |
| 115 | 10⁰ | 10³ | 10² | 10¹ | 10² | 10¹ | 10³ |
| 120 | 10⁰ | 10³ | 10² | 10¹ | 10² | 10¹ | 10³ |
---
## Trend Verification
- **Benign (Green)**: Dominates early flow lengths (0–5s) with a logarithmic decline.
- **Infiltration (Yellow)**: Peaks at 0–5s, then declines sharply.
- **Web-Attack (Gray)**: Minimal except for a spike at 85s.
- **DoS (Red)**: Consistent but smaller than Benign.
- **DDoS (Blue)**: Peaks at 30–40s.
- **BoT (Orange)**: Peaks at 15–20s.
- **BruteForce (Purple)**: Rare across all flow lengths.
---
## Final Notes
- The chart uses a **logarithmic y-axis** to accommodate the wide range of frequencies.
- No non-English text is present.
- All legend colors are accurately mapped to their respective categories.
- Data points are extracted based on visual segmentation of bars and cross-referenced with the legend.