# Technical Document Extraction: Perplexity vs. Context Size Chart
## 1. Image Overview
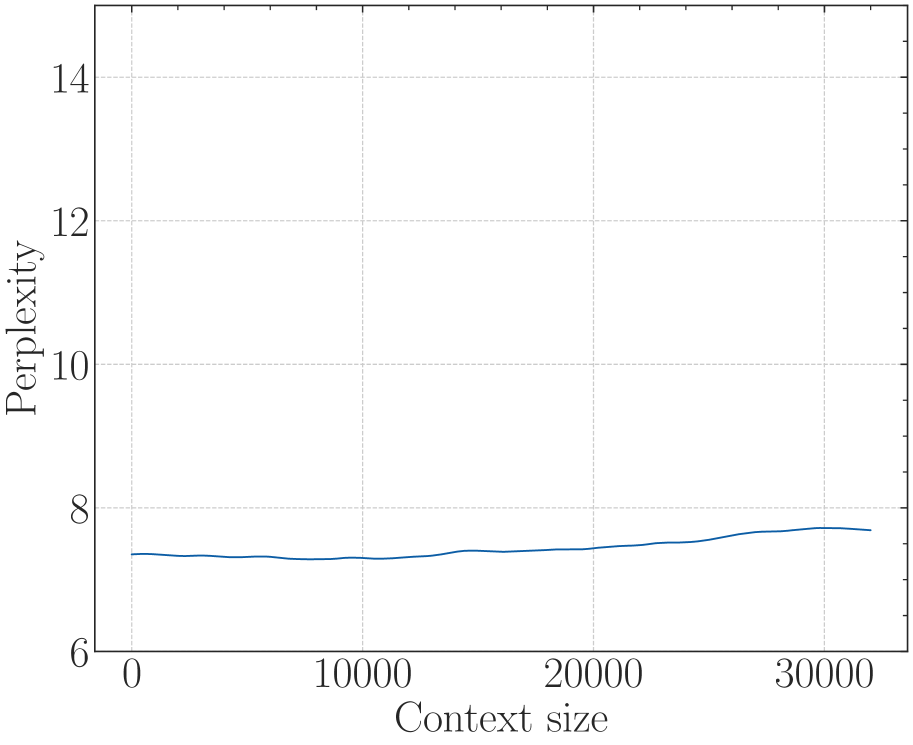
This image is a line graph illustrating the relationship between "Perplexity" and "Context size" for a computational model (likely a Large Language Model). The chart uses a clean, academic style with a serif font and a light gray grid.
## 2. Component Isolation
### Header/Title
* **Content:** None present.
### Main Chart Area
* **Background:** White with a light gray dashed grid.
* **Grid Lines:** Vertical grid lines occur every 10,000 units on the x-axis. Horizontal grid lines occur every 2 units on the y-axis.
* **Data Series:** A single solid dark blue line.
### Axis Labels and Markers
* **Y-Axis (Vertical):**
* **Label:** "Perplexity" (oriented vertically).
* **Scale:** 6 to 15 (visible range).
* **Major Tick Marks:** 6, 8, 10, 12, 14.
* **Minor Tick Marks:** Present between major ticks, indicating increments of 1 unit.
* **X-Axis (Horizontal):**
* **Label:** "Context size".
* **Scale:** 0 to approximately 32,000.
* **Major Tick Marks:** 0, 10000, 20000, 30000.
* **Minor Tick Marks:** Present at intervals of 2,500 units.
### Legend
* **Location:** Not present. As there is only one data series, the blue line represents the primary metric.
## 3. Data Extraction and Trend Analysis
### Trend Verification
* **Series 1 (Dark Blue Line):** The line begins at a context size of 0 with a perplexity value slightly above 7. It remains remarkably stable and flat for the first 15,000 units, showing a very slight downward dip before recovering. After the 15,000 mark, the line exhibits a very gradual upward slope, ending just below the 8.0 mark at a context size of 32,000.
### Estimated Data Points
Based on the grid alignment, the following values are extracted:
| Context size (x) | Perplexity (y) | Notes |
| :--- | :--- | :--- |
| 0 | ~7.3 | Starting point. |
| 5,000 | ~7.3 | Stable. |
| 10,000 | ~7.2 | Slightest local minimum. |
| 15,000 | ~7.4 | Beginning of very gradual ascent. |
| 20,000 | ~7.5 | Continuing gradual ascent. |
| 25,000 | ~7.6 | Continuing gradual ascent. |
| 30,000 | ~7.7 | Near peak of the visible range. |
| 32,000 | ~7.7 | Final data point; slight plateau/dip at the very end. |
## 4. Technical Summary
The chart demonstrates the **stability of model performance** (measured by perplexity) as the input context window increases.
* **Key Finding:** The perplexity remains within a very narrow band (approximately 7.2 to 7.7) across a context size of 0 to 32,000 tokens.
* **Significance:** In language modeling, lower perplexity indicates better performance. The fact that the line does not "explode" or rise sharply at higher context sizes suggests the model maintains its predictive accuracy and coherence even when processing very long sequences of text.