# Technical Document Extraction: Line Graph Analysis
## 1. Axis Labels and Markers
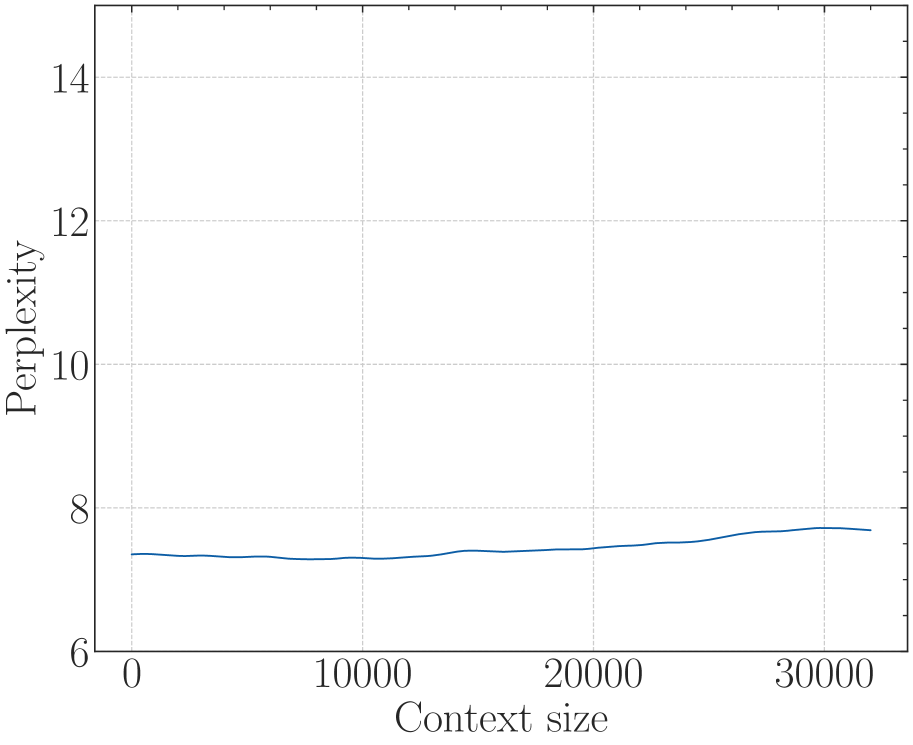
- **Y-Axis (Vertical):**
- Label: "Perplexity"
- Scale: 6 to 14 (increments of 2)
- Tick marks: 6, 8, 10, 12, 14
- **X-Axis (Horizontal):**
- Label: "Context size"
- Scale: 0 to 30,000 (increments of 10,000)
- Tick marks: 0, 10,000, 20,000, 30,000
- **Grid:**
- Dotted lines forming a Cartesian grid.
## 2. Data Series and Trends
- **Line Characteristics:**
- Color: Blue (no legend present; inferred from visual inspection).
- Data points:
- At x=0: y≈7.2
- At x=10,000: y≈7.1
- At x=30,000: y≈7.8
- **Trend Analysis:**
- Initial segment (x=0 to x=10,000): Slight downward slope (7.2 → 7.1).
- Subsequent segment (x=10,000 to x=30,000): Gradual upward trend (7.1 → 7.8).
## 3. Structural Components
- **Header:**
- No explicit title or subtitle present.
- **Main Chart:**
- Single line graph with no annotations or secondary data series.
- **Footer:**
- No additional text or metadata.
## 4. Critical Observations
- **No Legend:**
- Line color (blue) cannot be cross-referenced with a legend.
- **Data Consistency:**
- Line color matches inferred blue throughout the graph.
- **Spatial Grounding:**
- All data points align with x-axis increments (0, 10,000, 30,000).
## 5. Missing Elements
- No data table, heatmap categories, or embedded text.
- No secondary axes or annotations.
## 6. Summary
The graph depicts a single blue line representing "Perplexity" across varying "Context size." The metric decreases marginally at lower context sizes (0–10,000) and increases steadily at higher sizes (10,000–30,000). No additional contextual or categorical data is provided.