\n
## Diagram: Trust Vulnerability Map in Retrieval-Augmented Generation Systems
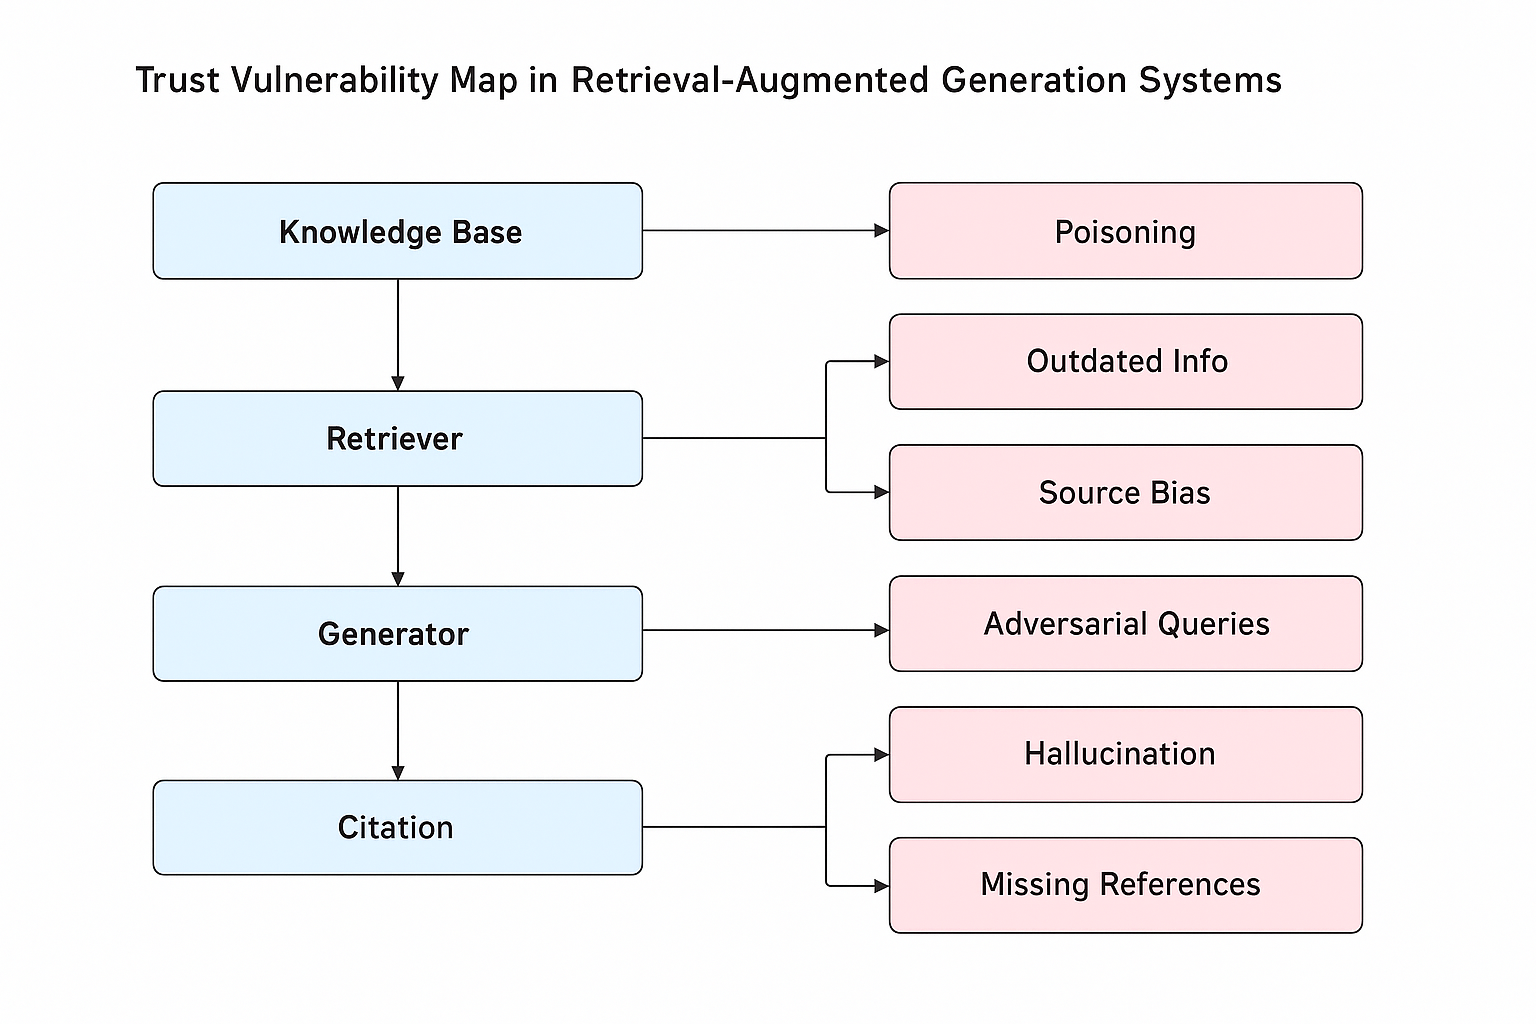
### Overview
The image is a diagram illustrating potential vulnerabilities in Retrieval-Augmented Generation (RAG) systems. It depicts a flow chart showing how vulnerabilities can arise at different stages of the RAG pipeline: Knowledge Base, Retriever, Generator, and Citation. The diagram uses rectangular boxes to represent components and vulnerabilities, connected by arrows indicating potential pathways for issues.
### Components/Axes
The diagram consists of the following components:
* **Knowledge Base:** A light blue rectangle.
* **Retriever:** A light blue rectangle.
* **Generator:** A light blue rectangle.
* **Citation:** A light blue rectangle.
* **Poisoning:** A light orange rectangle.
* **Outdated Info:** A light orange rectangle.
* **Source Bias:** A light orange rectangle.
* **Adversarial Queries:** A light orange rectangle.
* **Hallucination:** A light orange rectangle, with a reddish hue.
* **Missing References:** A light orange rectangle.
Arrows connect these components, showing the flow of information and potential vulnerabilities. The title of the diagram is "Trust Vulnerability Map in Retrieval-Augmented Generation Systems" and is positioned at the top-center of the image.
### Detailed Analysis or Content Details
The diagram illustrates the following relationships:
1. **Knowledge Base** is connected to **Poisoning** and **Outdated Info**.
2. **Retriever** is connected to **Poisoning**, **Outdated Info**, and **Source Bias**.
3. **Generator** is connected to **Adversarial Queries** and **Hallucination**.
4. **Citation** is connected to **Hallucination** and **Missing References**.
The flow is sequential: Knowledge Base -> Retriever -> Generator -> Citation. Each component has potential vulnerabilities associated with it. The diagram does not contain numerical data.
### Key Observations
The diagram highlights that vulnerabilities can occur at every stage of the RAG pipeline. The "Hallucination" vulnerability is visually distinguished by a reddish hue, potentially indicating it is considered a more critical issue. The diagram emphasizes the interconnectedness of the components and how issues in one stage can propagate to others.
### Interpretation
This diagram serves as a conceptual map of potential failure points in RAG systems. It suggests that building trustworthy RAG systems requires careful consideration of vulnerabilities at each stage of the pipeline.
* **Knowledge Base:** The vulnerabilities here relate to the quality and integrity of the underlying data. "Poisoning" suggests malicious data injection, while "Outdated Info" indicates the risk of using stale information.
* **Retriever:** This component is susceptible to issues stemming from the knowledge base, as well as its own biases in selecting relevant information ("Source Bias").
* **Generator:** The generator can be exploited through carefully crafted inputs ("Adversarial Queries") and may produce outputs that are not grounded in the retrieved information ("Hallucination").
* **Citation:** The final stage, citation, is vulnerable to issues related to the generator's output, such as "Hallucination" and the potential for "Missing References" which can undermine the credibility of the generated content.
The diagram is a high-level overview and doesn't provide specific mitigation strategies. However, it effectively communicates the importance of a holistic approach to trust and reliability in RAG systems. The diagram is a qualitative representation of risks, not a quantitative analysis.