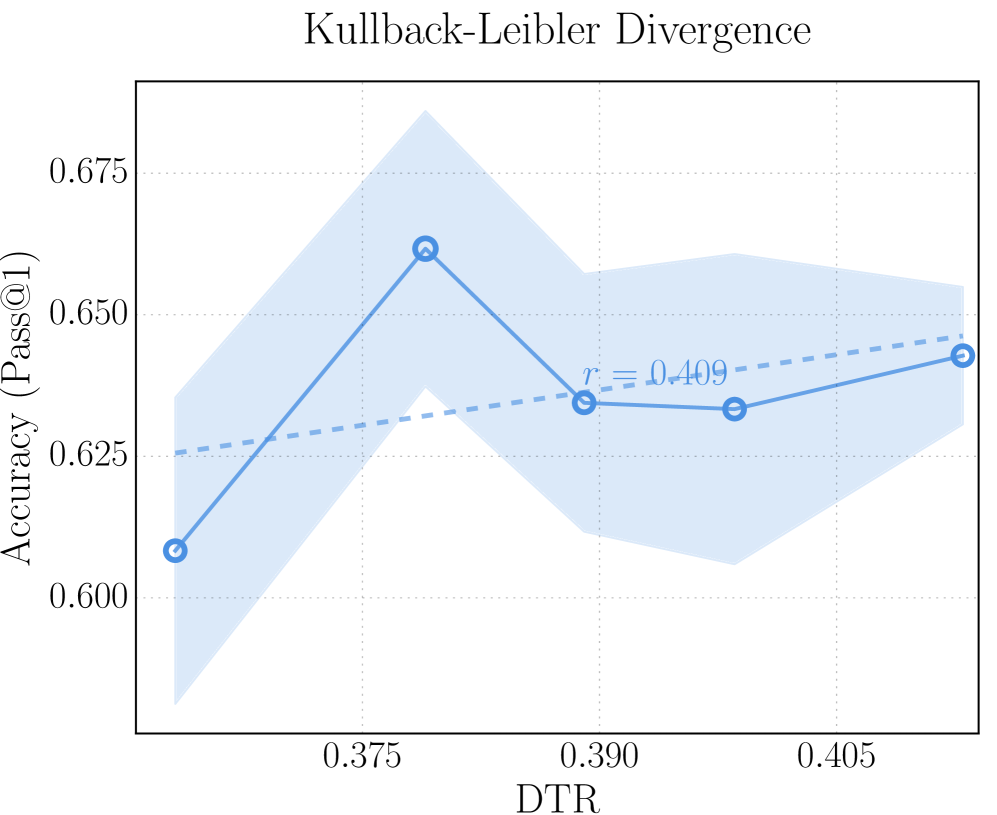
## Chart: Kullback-Leibler Divergence
### Overview
The image is a line chart titled "Kullback-Leibler Divergence". It plots "Accuracy (Pass@1)" on the y-axis against "DTR" on the x-axis. The chart displays a blue line with circular markers indicating data points, along with a shaded blue region around the line, presumably representing a confidence interval or standard deviation. A dashed blue line indicates a linear regression fit, with an 'r' value (correlation coefficient) displayed.
### Components/Axes
* **Title:** Kullback-Leibler Divergence
* **X-axis:**
* Label: DTR
* Scale: 0.375, 0.390, 0.405
* **Y-axis:**
* Label: Accuracy (Pass@1)
* Scale: 0.600, 0.625, 0.650, 0.675
* **Data Series:**
* Solid Blue Line: Represents the primary data series.
* Shaded Blue Region: Represents the uncertainty or variance around the primary data series.
* Dashed Blue Line: Represents a linear regression fit to the data.
* **Correlation Coefficient:** r = 0.409
### Detailed Analysis
* **X-axis (DTR) values:** 0.375, 0.390, 0.405
* **Y-axis (Accuracy (Pass@1)) values:**
* At DTR = 0.375, Accuracy ≈ 0.610
* At DTR = 0.375, Accuracy ≈ 0.665
* At DTR = 0.390, Accuracy ≈ 0.635
* At DTR = 0.405, Accuracy ≈ 0.635
* At DTR = 0.405, Accuracy ≈ 0.645
* **Trend of the Solid Blue Line:** The line initially increases sharply from DTR 0.375 to 0.375, then decreases to DTR 0.390, remains relatively flat until DTR 0.405, and then increases slightly.
* **Trend of the Dashed Blue Line:** The dashed blue line shows a slight upward trend, indicating a weak positive correlation.
* **Correlation Coefficient:** The correlation coefficient 'r' is 0.409, indicating a moderate positive correlation between DTR and Accuracy (Pass@1).
### Key Observations
* The accuracy peaks at DTR = 0.375, then decreases and stabilizes.
* The shaded region indicates the uncertainty is higher at the beginning and end of the DTR range.
* The correlation coefficient suggests a weak positive linear relationship.
### Interpretation
The chart explores the relationship between DTR and Accuracy (Pass@1) using Kullback-Leibler Divergence. The initial increase in accuracy suggests that increasing DTR initially improves performance. However, after a certain point (around 0.375 DTR), further increases in DTR do not lead to significant improvements in accuracy, and may even decrease it. The shaded region highlights the variability in accuracy at different DTR values. The correlation coefficient of 0.409 indicates a moderate positive linear relationship, but the non-linear trend of the data suggests that a linear model may not fully capture the relationship between DTR and accuracy.