\n
## Line Chart: Kullback-Leibler Divergence
### Overview
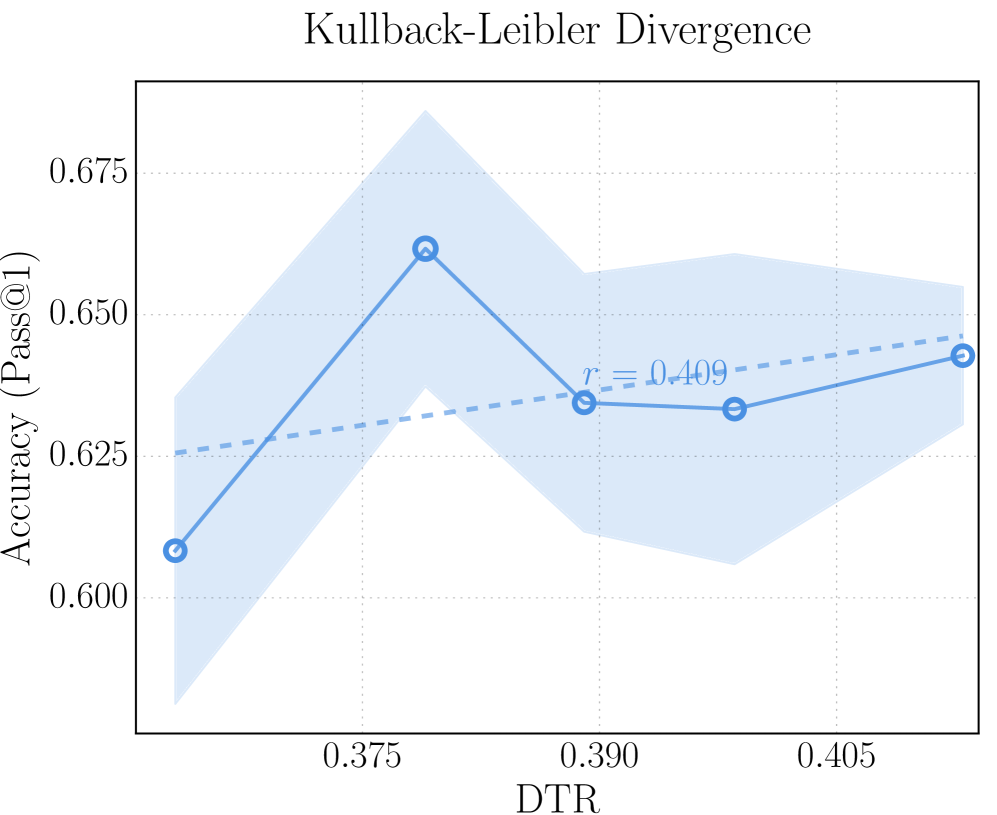
This image presents a line chart illustrating the relationship between DTR (likely a measure of diversity or distribution) and Accuracy (Pass@1). The chart includes a solid blue line representing the observed data, a dashed grey line representing a trendline, and a shaded blue region indicating the confidence interval around the observed data. A Pearson correlation coefficient (r) is also displayed.
### Components/Axes
* **Title:** Kullback-Leibler Divergence
* **X-axis:** DTR (ranging approximately from 0.37 to 0.41)
* **Y-axis:** Accuracy (Pass@1) (ranging approximately from 0.60 to 0.68)
* **Data Series 1:** Solid Blue Line - Observed Accuracy vs. DTR
* **Data Series 2:** Dashed Grey Line - Trendline
* **Confidence Interval:** Shaded Blue Region
* **Correlation Coefficient:** r = 0.409
### Detailed Analysis
The solid blue line shows a non-monotonic relationship between DTR and Accuracy.
* **Point 1:** At approximately DTR = 0.37, Accuracy is approximately 0.61.
* **Point 2:** At approximately DTR = 0.375, Accuracy peaks at approximately 0.665.
* **Point 3:** At approximately DTR = 0.39, Accuracy decreases to approximately 0.63. The correlation coefficient, r = 0.409, is displayed near this point.
* **Point 4:** At approximately DTR = 0.405, Accuracy increases slightly to approximately 0.64.
* **Point 5:** At approximately DTR = 0.41, Accuracy increases to approximately 0.65.
The dashed grey line represents a general upward trend, though it doesn't perfectly fit the observed data. The shaded blue region around the solid blue line indicates the uncertainty in the accuracy measurements. The confidence interval is wider around DTR = 0.39, suggesting greater variability in accuracy at that point.
### Key Observations
* The relationship between DTR and Accuracy is not strictly linear. Accuracy increases initially with DTR, then decreases, and then shows a slight increase again.
* The correlation coefficient of 0.409 suggests a moderate positive correlation between DTR and Accuracy, but the non-monotonic behavior indicates the relationship is more complex than a simple linear correlation.
* The confidence interval is relatively wide, indicating some uncertainty in the accuracy measurements.
### Interpretation
The chart suggests that increasing DTR initially improves Accuracy (Pass@1), but beyond a certain point (around DTR = 0.375), further increases in DTR may lead to a decrease in accuracy. This could indicate an optimal level of diversity or distribution (DTR) for maximizing accuracy. The Kullback-Leibler Divergence, as the chart title suggests, is likely being used to measure the difference between two probability distributions, and the chart is exploring how this divergence impacts the model's accuracy. The moderate correlation suggests that DTR is a factor influencing accuracy, but other factors are also likely at play. The non-linear relationship implies that simply maximizing DTR will not necessarily maximize accuracy. The confidence intervals highlight the need for further investigation to confirm these trends and reduce uncertainty.