## Scatter Plot: Kullback-Leibler Divergence
### Overview
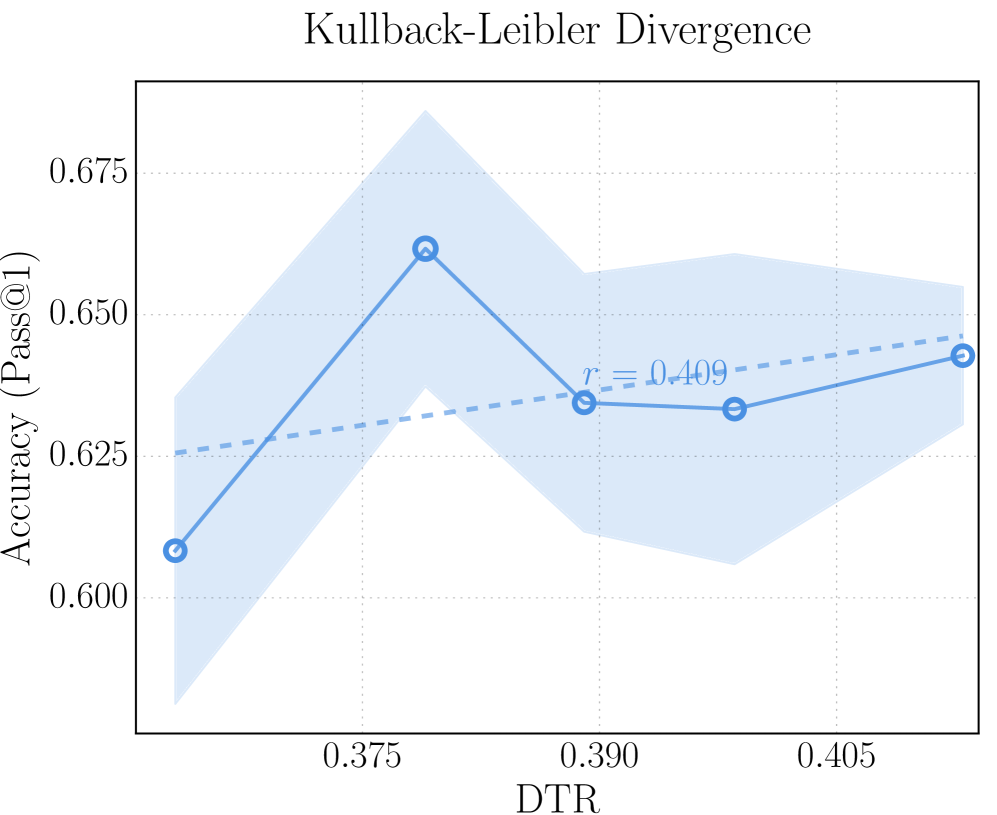
The image is a scatter plot titled "Kullback-Leibler Divergence," showing the relationship between DTR (Divergence Threshold Ratio) and Accuracy (Pass@1). The plot includes a solid line with data points, a dashed trend line, and a shaded confidence interval. Key annotations include a correlation coefficient (r = 0.409) and axis labels.
---
### Components/Axes
- **X-axis (DTR)**: Labeled "DTR" with values ranging from 0.375 to 0.405 in increments of 0.005.
- **Y-axis (Accuracy)**: Labeled "Accuracy (Pass@1)" with values from 0.600 to 0.675 in increments of 0.005.
- **Legend**: Located in the top-left corner, with two entries:
- Solid blue line: "Pass@1" (data points).
- Dashed blue line: "Trend Line" (r = 0.409).
- **Shaded Area**: Light blue region surrounding the solid line, likely representing a confidence interval or variability.
---
### Detailed Analysis
1. **Data Points**:
- **DTR = 0.375**: Accuracy ≈ 0.605 (solid blue circle).
- **DTR = 0.390**: Accuracy ≈ 0.635 (solid blue circle).
- **DTR = 0.400**: Accuracy ≈ 0.630 (solid blue circle).
- **DTR = 0.405**: Accuracy ≈ 0.640 (solid blue circle).
2. **Trend Line**:
- Dashed blue line with a correlation coefficient **r = 0.409**, indicating a moderate positive relationship between DTR and Accuracy.
3. **Shaded Area**:
- Light blue region spans the range of data points, suggesting variability or uncertainty in the relationship.
---
### Key Observations
- The solid line shows a **non-linear trend**: Accuracy increases sharply from DTR 0.375 to 0.390, then plateaus slightly before rising again at 0.405.
- The dashed trend line (r = 0.409) indicates a **weak positive correlation**, suggesting DTR explains ~16.7% of the variance in Accuracy (r² = 0.167).
- The shaded area highlights **high variability** in Accuracy at lower DTR values (e.g., 0.375–0.390) compared to higher DTR values (0.400–0.405).
---
### Interpretation
- **Relationship**: The moderate positive correlation (r = 0.409) implies that increasing DTR generally improves Accuracy, but the relationship is not strongly deterministic. Other factors likely influence Accuracy.
- **Optimal DTR**: The peak Accuracy (0.635) occurs at DTR = 0.390, suggesting this may be a local maximum. However, the trend line shows a slight upward trajectory beyond this point.
- **Confidence Interval**: The shaded area indicates uncertainty in the relationship, particularly at lower DTR values. This could reflect model instability or data sparsity in those regions.
- **Practical Implications**: While higher DTR values correlate with better performance, the weak correlation suggests trade-offs (e.g., computational cost, overfitting) may need consideration.
---
### Spatial Grounding
- **Legend**: Top-left corner, clearly labeling the solid and dashed lines.
- **Title**: Centered at the top of the plot.
- **Axes**: Grid lines align with axis ticks for precise value extraction.
- **Data Points**: Solid blue circles are evenly spaced along the x-axis, with the shaded area enveloping the solid line.
---
### Content Details
- **Textual Elements**:
- Title: "Kullback-Leibler Divergence"
- Axis Labels: "DTR" (x-axis), "Accuracy (Pass@1)" (y-axis)
- Legend: "Pass@1" (solid blue), "Trend Line" (dashed blue, r = 0.409)
- Annotations: "r = 0.409" near the dashed line.
- **Numerical Values**:
- DTR: 0.375, 0.390, 0.400, 0.405
- Accuracy: 0.605, 0.635, 0.630, 0.640
---
### Final Notes
The plot demonstrates a **moderate positive relationship** between DTR and Accuracy, with notable variability at lower DTR values. The shaded confidence interval and trend line provide context for interpreting the data, but the weak correlation (r = 0.409) suggests further investigation into confounding variables or model adjustments may be warranted.