## Scatter Plot: Log-Probability vs. l
### Overview
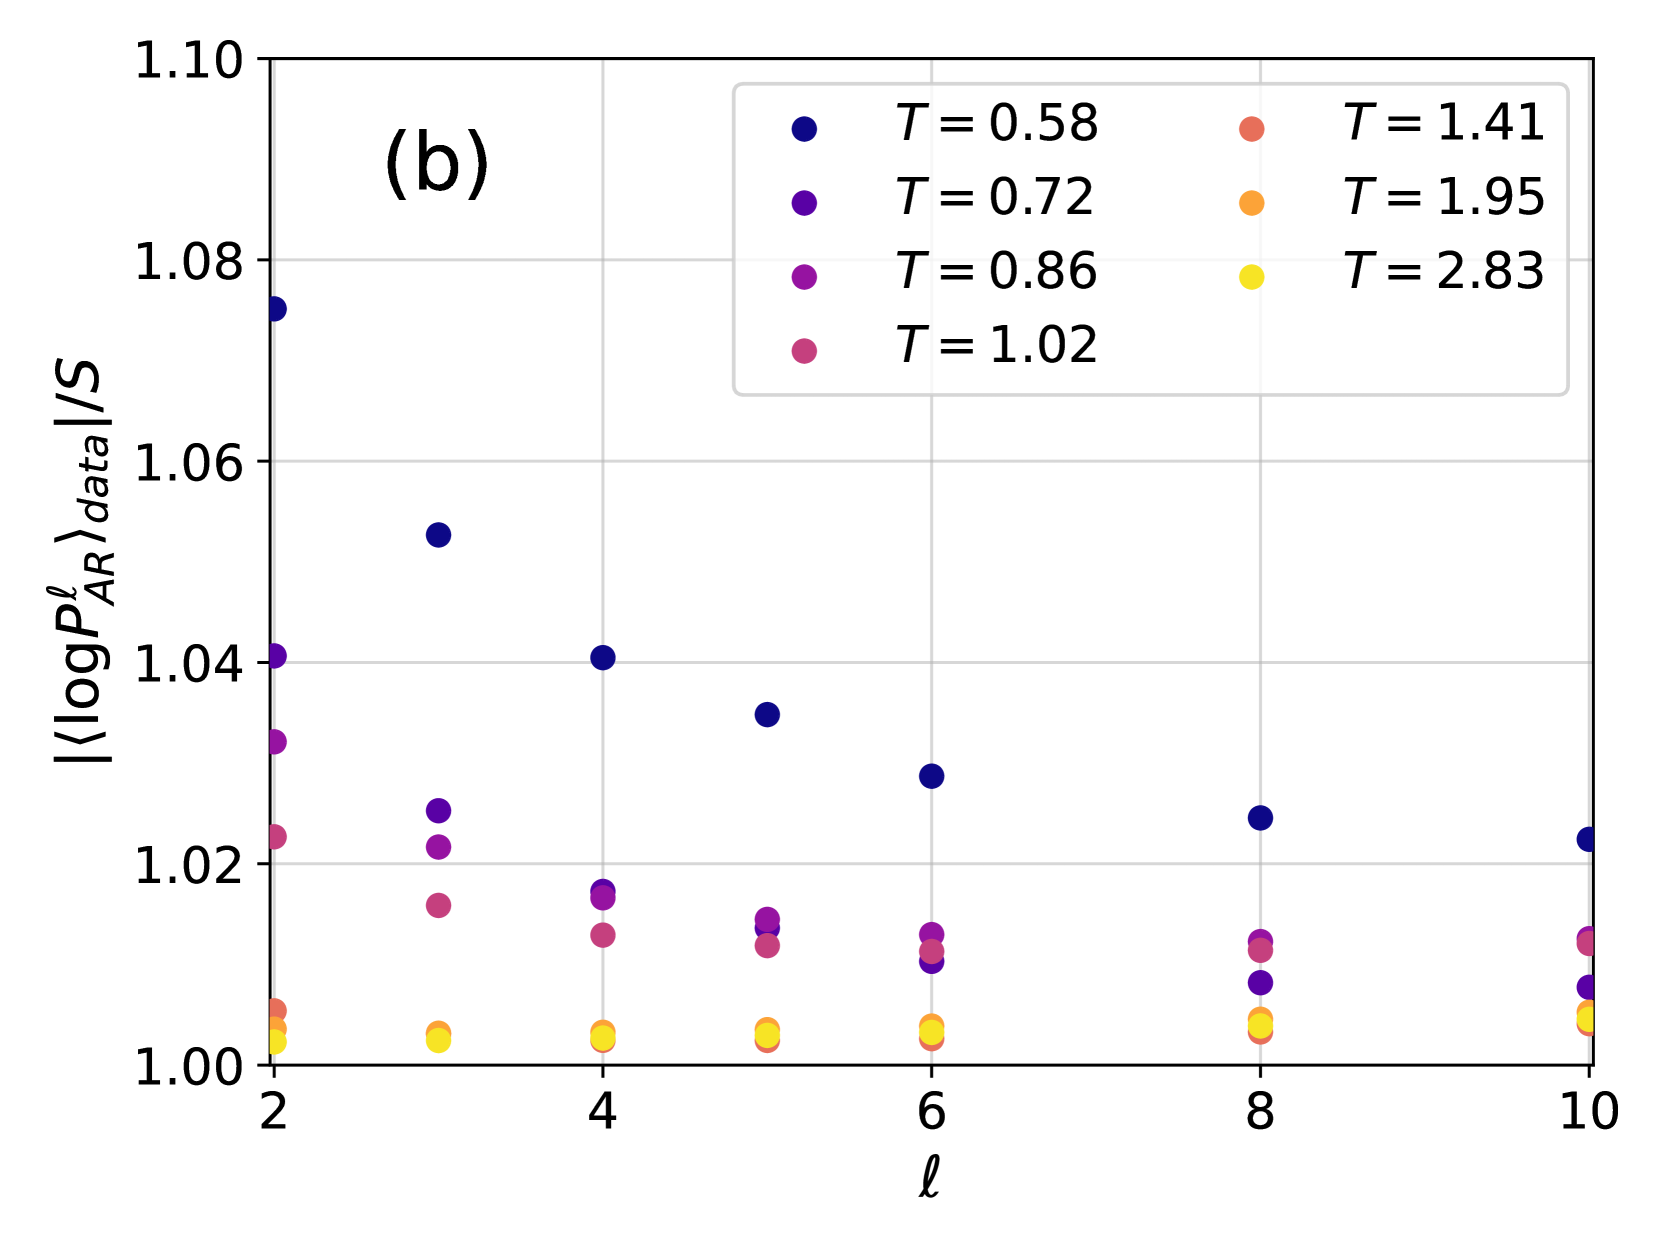
The image is a scatter plot displaying the relationship between the absolute value of the log probability ratio (|<log P_AR^l>_data|/S) and the variable 'l' for different temperatures (T). The plot includes data points for six different temperatures, each represented by a distinct color. The plot shows a general decreasing trend of the log probability ratio as 'l' increases, with variations depending on the temperature.
### Components/Axes
* **Title:** There is no overall title for the chart, but there is a label "(b)" in the top-left corner.
* **X-axis:**
* Label: 'l'
* Scale: 2, 4, 6, 8, 10
* **Y-axis:**
* Label: |<log P_AR^l>_data|/S
* Scale: 1.00, 1.02, 1.04, 1.06, 1.08, 1.10
* **Legend:** Located in the top-right corner.
* Dark Blue: T = 0.58
* Purple: T = 0.72
* Dark Magenta: T = 0.86
* Magenta: T = 1.02
* Coral: T = 1.41
* Orange: T = 1.95
* Yellow: T = 2.83
### Detailed Analysis
* **T = 0.58 (Dark Blue):** The line starts at approximately 1.075 at l=2 and decreases to approximately 1.02 at l=10.
* l = 2: ~1.075
* l = 4: ~1.04
* l = 6: ~1.025
* l = 8: ~1.025
* l = 10: ~1.02
* **T = 0.72 (Purple):** The line starts at approximately 1.04 at l=2 and decreases to approximately 1.01 at l=10.
* l = 2: ~1.04
* l = 4: ~1.02
* l = 6: ~1.015
* l = 8: ~1.01
* l = 10: ~1.01
* **T = 0.86 (Dark Magenta):** The line starts at approximately 1.03 at l=2 and decreases to approximately 1.008 at l=10.
* l = 2: ~1.03
* l = 4: ~1.015
* l = 6: ~1.01
* l = 8: ~1.008
* l = 10: ~1.008
* **T = 1.02 (Magenta):** The line starts at approximately 1.02 at l=2 and decreases to approximately 1.005 at l=10.
* l = 2: ~1.02
* l = 4: ~1.013
* l = 6: ~1.01
* l = 8: ~1.005
* l = 10: ~1.005
* **T = 1.41 (Coral):** The line starts at approximately 1.008 at l=2 and remains relatively constant around 1.003 at l=10.
* l = 2: ~1.008
* l = 4: ~1.003
* l = 6: ~1.003
* l = 8: ~1.003
* l = 10: ~1.003
* **T = 1.95 (Orange):** The line starts at approximately 1.003 at l=2 and remains relatively constant around 1.003 at l=10.
* l = 2: ~1.003
* l = 4: ~1.003
* l = 6: ~1.003
* l = 8: ~1.003
* l = 10: ~1.003
* **T = 2.83 (Yellow):** The line starts at approximately 1.002 at l=2 and remains relatively constant around 1.002 at l=10.
* l = 2: ~1.002
* l = 4: ~1.002
* l = 6: ~1.002
* l = 8: ~1.002
* l = 10: ~1.002
### Key Observations
* As 'l' increases, the value of |<log P_AR^l>_data|/S generally decreases for all temperatures.
* Higher temperatures (T = 1.41, 1.95, and 2.83) have lower values of |<log P_AR^l>_data|/S and remain relatively constant as 'l' increases.
* Lower temperatures (T = 0.58, 0.72, 0.86, and 1.02) show a more noticeable decrease in |<log P_AR^l>_data|/S as 'l' increases.
* The rate of decrease in |<log P_AR^l>_data|/S diminishes as 'l' increases, especially for lower temperatures.
### Interpretation
The plot suggests that the log probability ratio is influenced by both 'l' and temperature (T). The decreasing trend with increasing 'l' indicates that the relationship weakens as 'l' grows. The temperature dependence shows that higher temperatures lead to lower log probability ratios, suggesting a different state or behavior of the system at higher temperatures. The convergence of the higher temperature lines to a near-constant value implies that, beyond a certain temperature, the log probability ratio becomes less sensitive to changes in 'l'. The data may represent a system transitioning between different phases or states as temperature changes, with 'l' potentially representing a length scale or interaction range.