## Scatter Plots: Compute vs. Parameters and Steps
### Overview
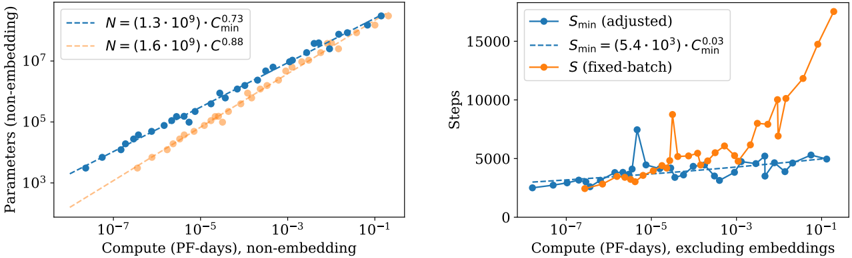
The image contains two side-by-side scatter plots comparing computational efficiency metrics. The left plot shows the relationship between compute (PF-days) and parameters (non-embedding), while the right plot compares compute (excluding embeddings) to steps (training iterations). Both plots use logarithmic scales on the x-axis and linear scales on the y-axis.
### Components/Axes
**Left Plot:**
- **X-axis**: Compute (PF-days), non-embedding (log scale: 1e-7 to 1e-1)
- **Y-axis**: Parameters (non-embedding) (log scale: 1e3 to 1e7)
- **Legend**:
- Blue dashed line: N = 1.3e9, C_min^0.73
- Orange dotted line: N = 1.6e9, C_min^0.88
**Right Plot:**
- **X-axis**: Compute (PF-days), excluding embeddings (log scale: 1e-7 to 1e-1)
- **Y-axis**: Steps (linear scale: 0 to 15,000)
- **Legend**:
- Blue solid circles: S_min (adjusted)
- Blue dashed line: S_min = 5.4e3 * C_min^0.03
- Orange squares: S (fixed-batch)
### Detailed Analysis
**Left Plot Trends:**
1. Both data series show a positive correlation between compute and parameters.
2. The orange series (N=1.6e9) has a steeper slope (C_min^0.88) compared to the blue series (C_min^0.73).
3. At 1e-3 PF-days, parameters reach ~1e6 for N=1.3e9 and ~1e6.5 for N=1.6e9.
4. At 1e-1 PF-days, parameters approach ~1e7 for both series.
**Right Plot Trends:**
1. S_min (adjusted) (blue circles) remains relatively stable (~2,000-4,000 steps) across compute ranges.
2. S_min = 5.4e3 * C_min^0.03 (blue dashed) shows minor fluctuations but stays below 5,000 steps.
3. S (fixed-batch) (orange squares) exhibits exponential growth:
- 1e-7 PF-days: ~1,000 steps
- 1e-5 PF-days: ~5,000 steps
- 1e-3 PF-days: ~10,000 steps
- 1e-1 PF-days: ~15,000 steps
### Key Observations
1. **Non-embedding parameters** scale polynomially with compute, with higher N values yielding steeper growth.
2. **Fixed-batch steps** increase dramatically with compute, while adjusted S_min remains stable.
3. The orange series in the left plot (N=1.6e9) consistently outperforms the blue series (N=1.3e9) in parameter efficiency.
4. The right plot reveals a critical threshold: fixed-batch steps surge beyond 1e-3 PF-days, suggesting diminishing returns for larger compute budgets.
### Interpretation
The data demonstrates fundamental trade-offs in model training:
1. **Parameter Efficiency**: Larger N values (1.6e9 vs. 1.3e9) achieve higher parameter counts per compute unit, but with diminishing returns (exponent 0.88 vs. 0.73).
2. **Step Efficiency**: Fixed-batch training becomes prohibitively expensive at scale, while adjusted S_min maintains stability through dynamic batch sizing.
3. **Compute Thresholds**: The right plot's exponential step growth beyond 1e-3 PF-days suggests a practical limit for fixed-batch training, while adjusted methods remain viable.
These findings highlight the importance of adaptive training strategies (like S_min adjustment) for large-scale model training, particularly when compute resources exceed 1e-3 PF-days.