## Bar Chart: Mean Success Rates Across Different Model Versions
### Overview
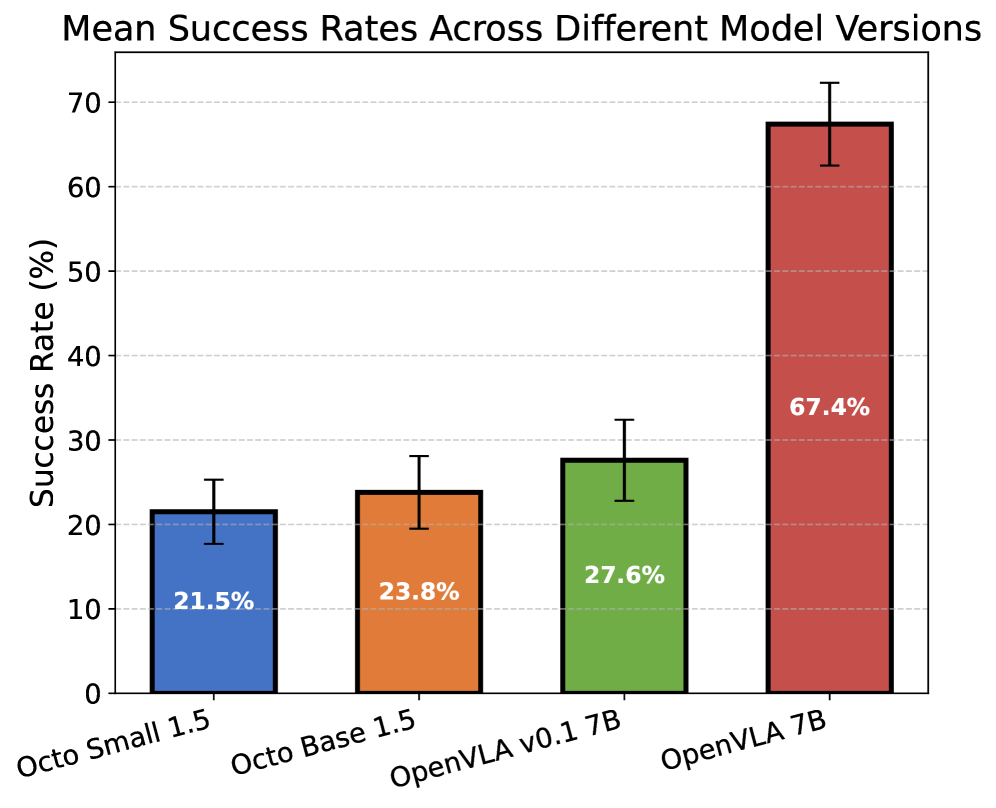
The image is a bar chart comparing the mean success rates of different model versions. The x-axis represents the model versions, and the y-axis represents the success rate in percentage. Error bars are displayed on top of each bar, indicating the variability in the success rates.
### Components/Axes
* **Title:** Mean Success Rates Across Different Model Versions
* **X-axis:** Model Versions (Octo Small 1.5, Octo Base 1.5, OpenVLA v0.1 7B, OpenVLA 7B)
* **Y-axis:** Success Rate (%)
* Scale: 0 to 70, with gridlines at intervals of 10.
* **Bars:**
* Octo Small 1.5: Blue
* Octo Base 1.5: Orange
* OpenVLA v0.1 7B: Green
* OpenVLA 7B: Red
### Detailed Analysis
The chart displays the following success rates for each model version:
* **Octo Small 1.5 (Blue):** 21.5%
* Error bar extends approximately from 21.5% to 25%
* **Octo Base 1.5 (Orange):** 23.8%
* Error bar extends approximately from 23.8% to 28%
* **OpenVLA v0.1 7B (Green):** 27.6%
* Error bar extends approximately from 27.6% to 32%
* **OpenVLA 7B (Red):** 67.4%
* Error bar extends approximately from 67.4% to 72%
### Key Observations
* The OpenVLA 7B model has a significantly higher success rate compared to the other models.
* The success rates of Octo Small 1.5, Octo Base 1.5, and OpenVLA v0.1 7B are relatively close to each other.
* The error bars suggest some variability in the success rates for each model.
### Interpretation
The data suggests that the OpenVLA 7B model is significantly more successful than the other models tested. The other three models (Octo Small 1.5, Octo Base 1.5, and OpenVLA v0.1 7B) have relatively similar success rates. The error bars indicate that there is some variation in the success rates, but the OpenVLA 7B model consistently outperforms the others. This could be due to differences in model architecture, training data, or other factors. The chart effectively demonstrates the performance difference between the different model versions.