## Line Chart: Relationship Between Non-Embedding Training FLOPs and Optimal Learning Rate
### Overview
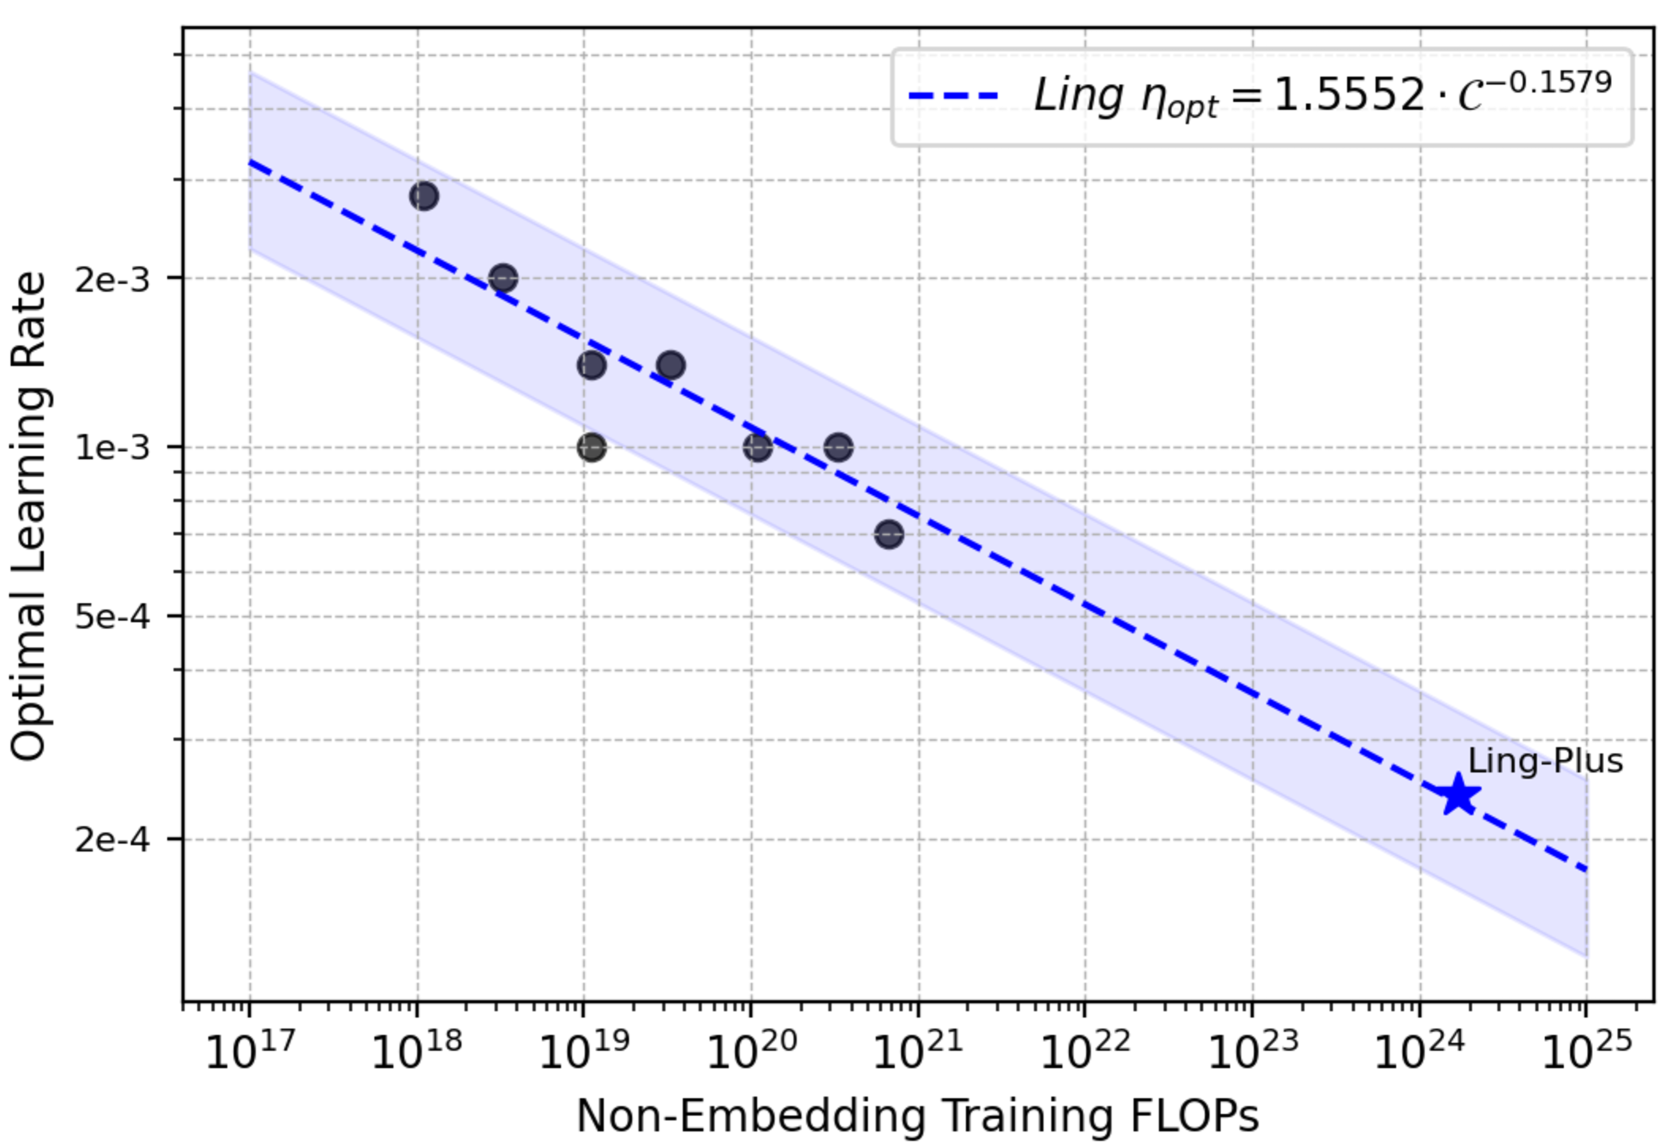
The chart illustrates an inverse relationship between non-embedding training computational resources (measured in FLOPs) and optimal learning rates. Data points follow a logarithmic decay trend, with a shaded confidence interval around the primary trend line.
### Components/Axes
- **X-axis**: Non-Embedding Training FLOPs (log scale: 10¹⁷ to 10²⁵)
- **Y-axis**: Optimal Learning Rate (log scale: 2e-4 to 2e-3)
- **Legend**:
- Dashed blue line labeled "Ling" with equation:
`Ling_ηopt = 1.5552 · C⁻⁰·¹⁵⁷⁹`
- Star marker labeled "Ling-Plus" at (10²⁴, 2e-4)
- **Additional Elements**:
- Shaded blue region (confidence interval) around the dashed line
- Black data points clustered along the trend line
### Detailed Analysis
1. **Trend Line**:
- The dashed blue line shows a power-law decay (exponent -0.1579) between learning rate and FLOPs.
- At 10¹⁸ FLOPs: Learning rate ≈ 2e-3
- At 10²⁰ FLOPs: Learning rate ≈ 1e-3
- At 10²⁴ FLOPs: Learning rate ≈ 2e-4 (marked by "Ling-Plus" star)
2. **Data Points**:
- 8 black dots distributed across the log-log plot, closely following the dashed line.
- Points at 10¹⁸–10²⁰ FLOPs cluster tightly around the 1e-3 learning rate range.
- No points below 2e-4 learning rate except the "Ling-Plus" outlier.
3. **Confidence Interval**:
- Shaded region spans ±10% of the trend line (approximate visual estimate).
- Width increases at higher FLOP values, suggesting greater uncertainty at scale.
### Key Observations
- **Inverse Scaling**: Learning rate decreases by ~1.5x for every 10x increase in FLOPs (exponent -0.1579).
- **Ling-Plus Anomaly**: The star marker at 10²⁴ FLOPs sits at the lower bound of the learning rate range, suggesting either:
- A more efficient architecture
- A different optimization strategy
- A potential outlier requiring further validation
- **Confidence Interval Behavior**: Uncertainty grows with scale, which is typical for power-law extrapolations.
### Interpretation
This chart demonstrates that larger-scale training (higher FLOPs) enables smaller optimal learning rates, critical for fine-tuning large language models. The "Ling-Plus" marker at 10²⁴ FLOPs with a 2e-4 learning rate suggests either:
1. A breakthrough in optimization efficiency
2. A potential data labeling error
3. A new architectural variant worth investigating
The power-law relationship (η ∝ C⁻⁰·¹⁵⁷⁹) implies diminishing returns in learning rate optimization beyond ~10²¹ FLOPs, where the confidence interval widens significantly. This highlights the importance of balancing computational scale with learning rate selection in large-scale training pipelines.