# Technical Data Extraction: Query Count Comparison by Method and Model
## 1. Image Overview
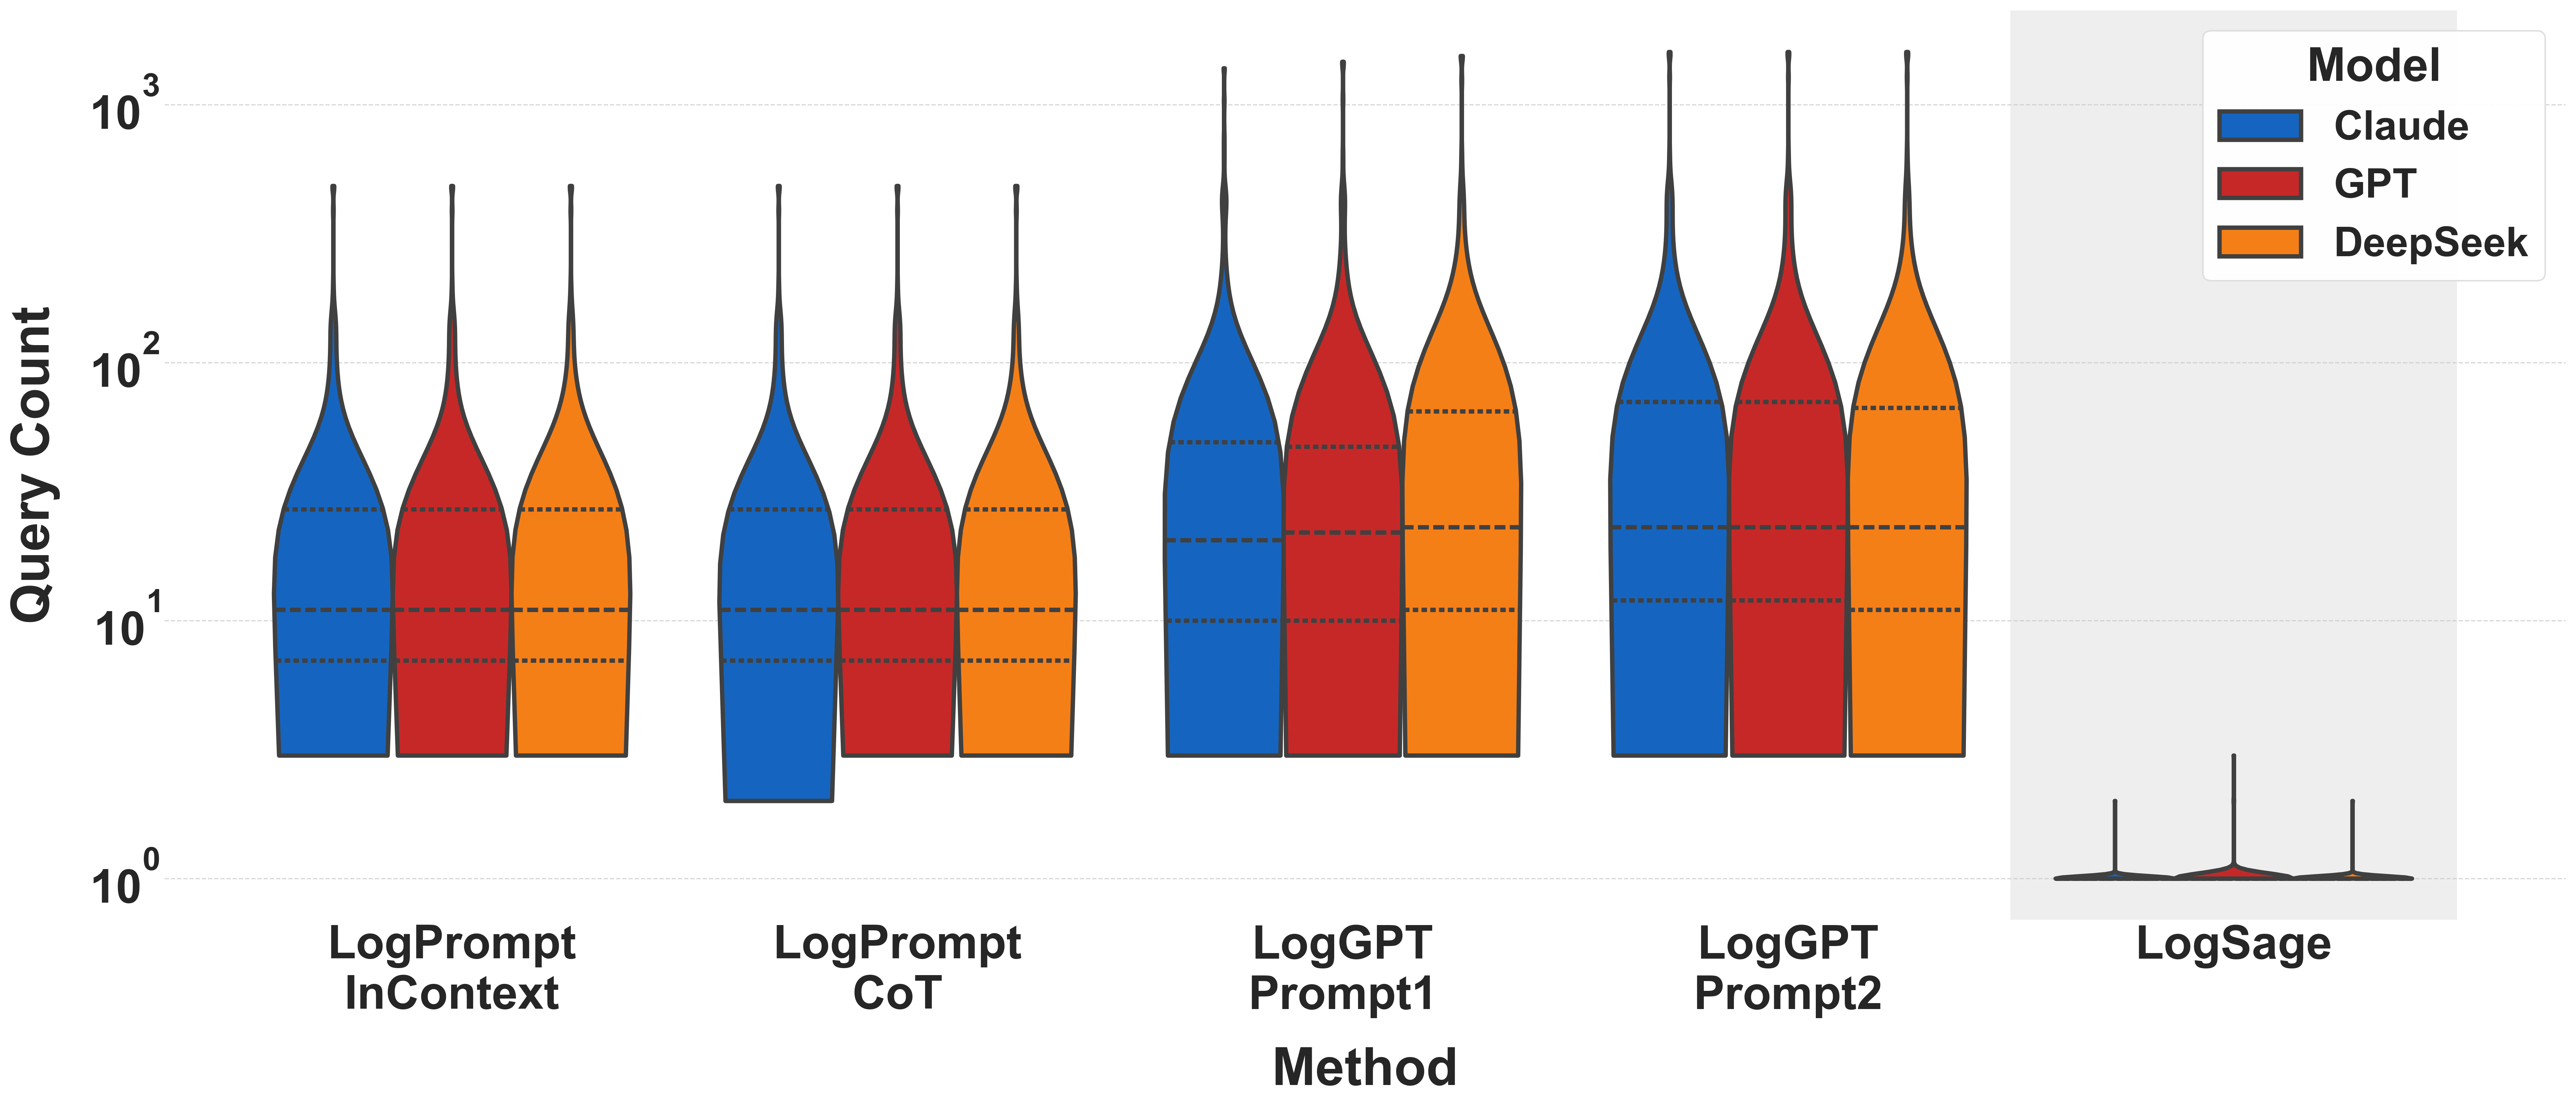
This image is a technical violin plot comparing the distribution of **Query Count** (y-axis) across five different **Methods** (x-axis) for three Large Language Model (LLM) families. The y-axis uses a logarithmic scale.
## 2. Component Isolation
### Header/Legend
* **Location:** Top right [x: 850-950, y: 10-250]
* **Title:** Model
* **Categories:**
* **Claude** (Blue: `#1565C0`)
* **GPT** (Red: `#C62828`)
* **DeepSeek** (Orange: `#EF6C00`)
### Axis Definitions
* **Y-Axis (Vertical):**
* **Label:** Query Count
* **Scale:** Logarithmic ($10^0, 10^1, 10^2, 10^3$)
* **Gridlines:** Horizontal dashed lines at major log intervals.
* **X-Axis (Horizontal):**
* **Label:** Method
* **Categories:**
1. LogPrompt InContext
2. LogPrompt CoT
3. LogGPT Prompt1
4. LogGPT Prompt2
5. LogSage (Highlighted in a grey background box)
## 3. Data Extraction and Trend Analysis
Each "Method" contains a cluster of three violin plots (Blue, Red, Orange). The dashed horizontal lines within the violins represent the quartiles (25th, 50th/Median, and 75th percentiles).
### Method 1: LogPrompt InContext
* **Trend:** All three models show nearly identical distributions.
* **Data Points (Approximate):**
* **Median:** ~11 queries.
* **Range:** From ~3 to ~500 queries.
* **Interquartile Range (IQR):** Concentrated between ~7 and ~30.
### Method 2: LogPrompt CoT
* **Trend:** Similar to InContext, but Claude (Blue) shows a slightly lower tail extending down toward $10^0$.
* **Data Points (Approximate):**
* **Median:** ~11 queries.
* **Range:** ~3 to ~500 queries.
### Method 3: LogGPT Prompt1
* **Trend:** Significant upward shift in query count compared to LogPrompt methods. DeepSeek (Orange) shows a higher median than Claude and GPT.
* **Data Points (Approximate):**
* **Claude/GPT Median:** ~20 queries.
* **DeepSeek Median:** ~25 queries.
* **Upper Tail:** Extends above $10^3$ (1,000+ queries).
### Method 4: LogGPT Prompt2
* **Trend:** Highest query counts among the first four methods. Distributions are wider at the top, indicating more frequent high-query sessions.
* **Data Points (Approximate):**
* **Median (All):** ~25 queries.
* **75th Percentile:** ~70-80 queries.
* **Upper Tail:** Extends to the top of the chart (~1,500 queries).
### Method 5: LogSage (Special Case)
* **Visual Context:** This section is isolated with a grey background.
* **Trend:** Drastic reduction in query count. The violins are "squashed" at the very bottom of the log scale.
* **Data Points (Approximate):**
* **Median:** ~1 query ($10^0$).
* **Maximum:** Rarely exceeds 3-5 queries.
* **Observation:** This method represents a near-total optimization of query efficiency compared to LogPrompt and LogGPT.
## 4. Summary Table of Estimated Medians
| Method | Claude (Blue) | GPT (Red) | DeepSeek (Orange) |
| :--- | :--- | :--- | :--- |
| **LogPrompt InContext** | ~11 | ~11 | ~11 |
| **LogPrompt CoT** | ~11 | ~11 | ~11 |
| **LogGPT Prompt1** | ~20 | ~20 | ~25 |
| **LogGPT Prompt2** | ~25 | ~25 | ~25 |
| **LogSage** | ~1 | ~1 | ~1 |
## 5. Technical Observations
* **Consistency:** Across most methods, the three models (Claude, GPT, DeepSeek) perform very similarly, suggesting the **Method** is a stronger determinant of query count than the specific **Model** used.
* **Efficiency:** LogSage is the most efficient method by an order of magnitude.
* **Complexity:** LogGPT Prompt2 is the most "expensive" method in terms of query volume.