## Line Charts: Evolution of Knowledge and Reasoning
### Overview
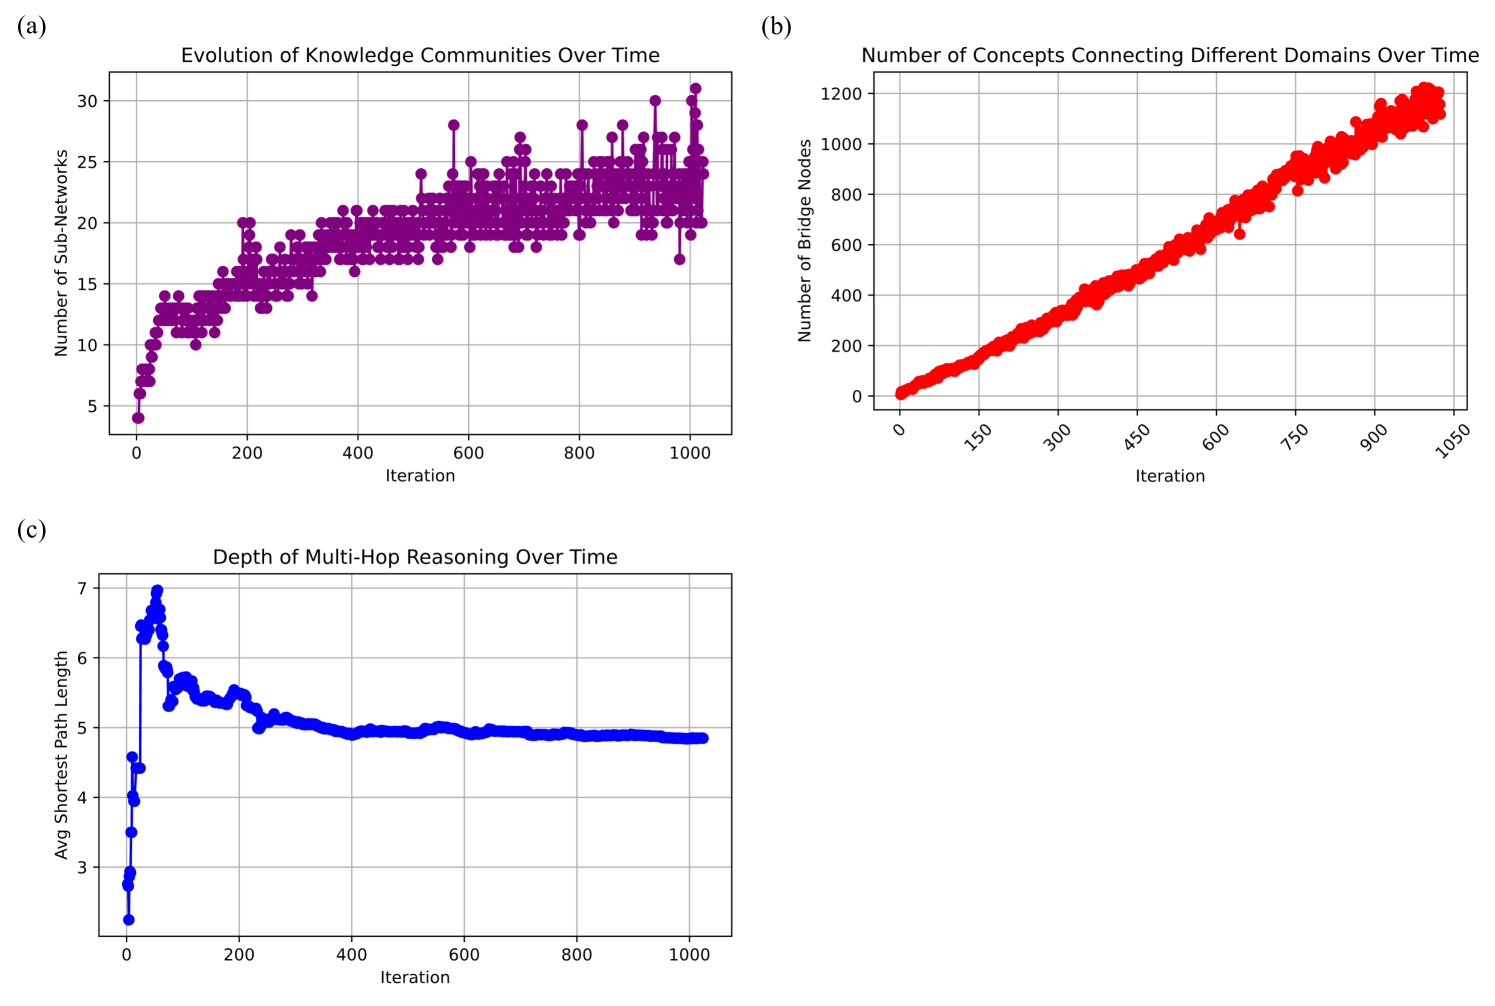
The image presents three line charts illustrating the evolution of knowledge communities, the number of concepts connecting different domains, and the depth of multi-hop reasoning over time. Each chart plots data against "Iteration" on the x-axis.
### Components/Axes
**Chart (a): Evolution of Knowledge Communities Over Time**
* **Title:** Evolution of Knowledge Communities Over Time
* **X-axis:** Iteration (ranging from 0 to 1000)
* **Y-axis:** Number of Sub-Networks (ranging from 5 to 30)
* **Data Series:** A purple line representing the number of sub-networks.
**Chart (b): Number of Concepts Connecting Different Domains Over Time**
* **Title:** Number of Concepts Connecting Different Domains Over Time
* **X-axis:** Iteration (ranging from 0 to 1050)
* **Y-axis:** Number of Bridge Nodes (ranging from 0 to 1200)
* **Data Series:** A red line representing the number of bridge nodes.
**Chart (c): Depth of Multi-Hop Reasoning Over Time**
* **Title:** Depth of Multi-Hop Reasoning Over Time
* **X-axis:** Iteration (ranging from 0 to 1000)
* **Y-axis:** Avg Shortest Path Length (ranging from 3 to 7)
* **Data Series:** A blue line representing the average shortest path length.
### Detailed Analysis
**Chart (a): Evolution of Knowledge Communities Over Time**
* **Trend:** The purple line shows an initial rapid increase in the number of sub-networks, followed by a period of fluctuation and eventual stabilization.
* **Data Points:**
* At Iteration 0, the number of sub-networks is approximately 6.
* By Iteration 200, the number of sub-networks reaches approximately 17.
* From Iteration 600 onwards, the number of sub-networks fluctuates between approximately 22 and 28.
**Chart (b): Number of Concepts Connecting Different Domains Over Time**
* **Trend:** The red line shows a generally linear, positive trend, indicating a steady increase in the number of bridge nodes over time.
* **Data Points:**
* At Iteration 0, the number of bridge nodes is approximately 0.
* At Iteration 300, the number of bridge nodes is approximately 300.
* At Iteration 600, the number of bridge nodes is approximately 700.
* At Iteration 900, the number of bridge nodes is approximately 1050.
**Chart (c): Depth of Multi-Hop Reasoning Over Time**
* **Trend:** The blue line shows an initial spike in the average shortest path length, followed by a sharp decline and then stabilization.
* **Data Points:**
* At Iteration 0, the average shortest path length is approximately 2.5.
* Around Iteration 50, the average shortest path length peaks at approximately 7.
* By Iteration 200, the average shortest path length drops to approximately 5.2.
* From Iteration 400 onwards, the average shortest path length stabilizes around 5.
### Key Observations
* The number of sub-networks (Chart a) initially grows rapidly but plateaus over time.
* The number of bridge nodes (Chart b) increases linearly with iteration.
* The average shortest path length (Chart c) initially spikes and then decreases to a stable level.
### Interpretation
The charts suggest that as the number of iterations increases:
* The knowledge communities initially evolve rapidly, forming new sub-networks, but this growth slows down as the system matures.
* The number of concepts connecting different domains increases steadily, indicating a continuous integration of knowledge.
* The depth of multi-hop reasoning initially increases, possibly due to exploration of new connections, but then decreases and stabilizes, suggesting that the system finds more efficient reasoning paths over time.
The relationship between these elements suggests a dynamic system where knowledge is initially fragmented but becomes more integrated and efficient over time. The initial spike in reasoning depth might represent a period of exploration, while the subsequent stabilization indicates optimization and refinement of reasoning processes.