## Line Charts: Evolution of Knowledge Graph Metrics
### Overview
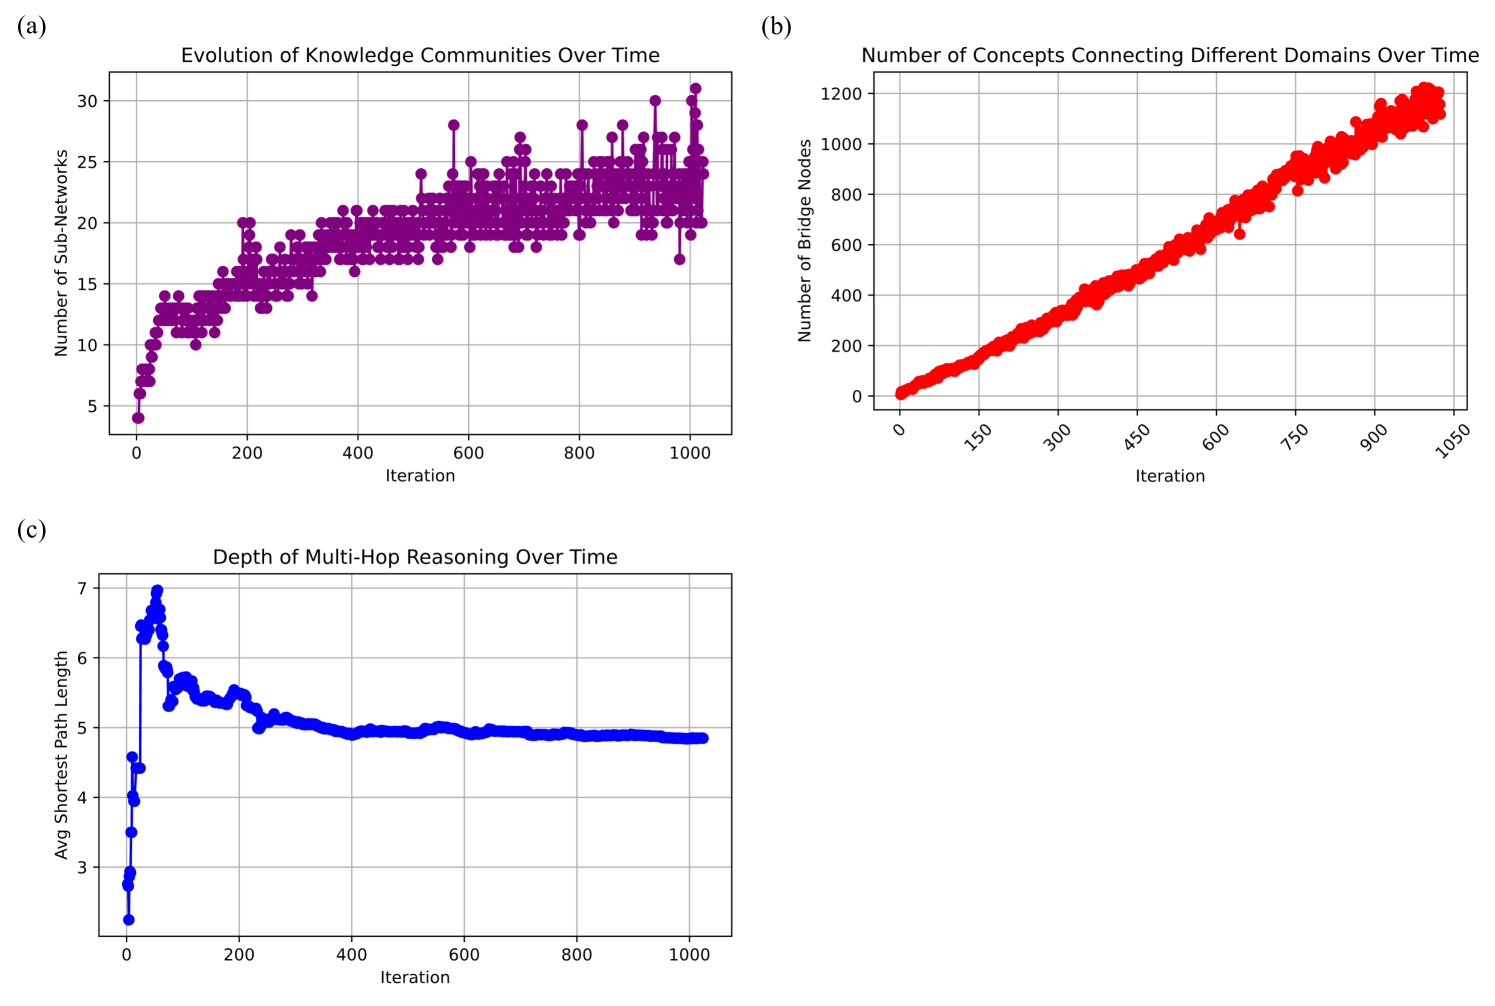
This image displays three distinct line charts, labeled (a), (b), and (c), tracking the evolution of a knowledge graph system over approximately 1,000 iterations. The charts visualize the growth of communities, the connectivity between domains, and the depth of reasoning within the system.
---
### Components/Axes
**Chart (a): Evolution of Knowledge Communities Over Time**
* **Position:** Top-left quadrant.
* **X-Axis:** "Iteration" (Scale: 0 to 1000, with major grid lines every 200 units).
* **Y-Axis:** "Number of Sub-Networks" (Scale: 5 to 30, with major grid lines every 5 units).
* **Data Series:** Purple line with circular markers.
**Chart (b): Number of Concepts Connecting Different Domains Over Time**
* **Position:** Top-right quadrant.
* **X-Axis:** "Iteration" (Scale: 0 to 1050, with major grid lines every 150 units).
* **Y-Axis:** "Number of Bridge Nodes" (Scale: 0 to 1200, with major grid lines every 200 units).
* **Data Series:** Red line with circular markers.
**Chart (c): Depth of Multi-Hop Reasoning Over Time**
* **Position:** Bottom-left quadrant.
* **X-Axis:** "Iteration" (Scale: 0 to 1000, with major grid lines every 200 units).
* **Y-Axis:** "Avg Shortest Path Length" (Scale: 2 to 7, with major grid lines every 1 unit).
* **Data Series:** Blue line with circular markers.
---
### Detailed Analysis
#### Chart (a): Evolution of Knowledge Communities
* **Visual Trend:** The data shows a rapid, steep upward trend in the first 100 iterations, followed by a slower, sustained upward trend with significant volatility (fluctuations) as the iteration count increases.
* **Data Points:**
* **Start (Iteration 0):** Begins at approximately 4 sub-networks.
* **Early Growth (Iteration ~100):** Reaches approximately 15 sub-networks.
* **Mid-point (Iteration ~500):** Fluctuates between 18 and 20 sub-networks.
* **End (Iteration 1000):** The value is approximately 24-25 sub-networks, with a notable outlier spike reaching 30 near the end.
#### Chart (b): Number of Concepts Connecting Different Domains
* **Visual Trend:** The data exhibits a strong, consistent, and nearly perfectly linear upward trend throughout the entire duration.
* **Data Points:**
* **Start (Iteration 0):** Begins at 0 bridge nodes.
* **Mid-point (Iteration 500):** Reaches approximately 550-600 bridge nodes.
* **End (Iteration 1000):** Reaches approximately 1150-1200 bridge nodes.
#### Chart (c): Depth of Multi-Hop Reasoning
* **Visual Trend:** The data shows a sharp, aggressive spike in the first 50 iterations, followed by a rapid decay, and finally a stabilization phase where the path length plateaus.
* **Data Points:**
* **Start (Iteration 0):** Begins at approximately 2.2.
* **Peak (Iteration ~50):** Reaches a maximum of approximately 7.0.
* **Stabilization (Iteration 400-1000):** The value levels off and remains consistently between 4.8 and 5.0.
---
### Key Observations
* **Correlation of Growth:** While the number of sub-networks (a) and bridge nodes (b) continue to grow throughout the 1000 iterations, the average shortest path length (c) stabilizes. This suggests that while the knowledge graph is expanding in size and complexity, it is maintaining a "small-world" property where the distance between nodes does not grow proportionally with the number of nodes.
* **Volatility:** Chart (a) exhibits the highest degree of volatility (noise) in its data points compared to the relatively smooth lines in (b) and (c).
* **Early Phase Dynamics:** The first 100-200 iterations represent a "formation phase" where the system undergoes rapid structural changes (sharp increases in sub-networks and path length).
---
### Interpretation
The data demonstrates the maturation of a knowledge graph system.
1. **Structural Expansion:** The linear growth of "Bridge Nodes" (b) indicates that the system is successfully and consistently linking disparate domains, preventing the knowledge graph from becoming a collection of isolated silos.
2. **Community Formation:** The growth in "Sub-Networks" (a) suggests that as the system adds more concepts, it organizes them into distinct clusters or communities rather than a single, undifferentiated mass.
3. **Reasoning Efficiency:** The stabilization of the "Avg Shortest Path Length" (c) is a critical finding. In graph theory, if the path length were to increase linearly with the number of nodes, the graph would become inefficient for reasoning. The fact that it stabilizes at ~5.0 suggests the system is effectively optimizing its connectivity, allowing for multi-hop reasoning to remain computationally feasible even as the graph grows to over 1000 bridge nodes.
In summary, the system is successfully scaling its knowledge base while maintaining structural efficiency.