TECHNICAL ASSET FINGERPRINT
14340b0f42fac643693f4cbc
Click to view fullscreen
Press ESC or click to close
FOUND IN PAPERS
EXPERT: gemini-3.1-pro-preview VERSION 1
RUNTIME: gemini/gemini-3.1-pro-preview
INTEL_VERIFIED
## Line Charts: Network and Knowledge Graph Evolution Metrics
### Overview
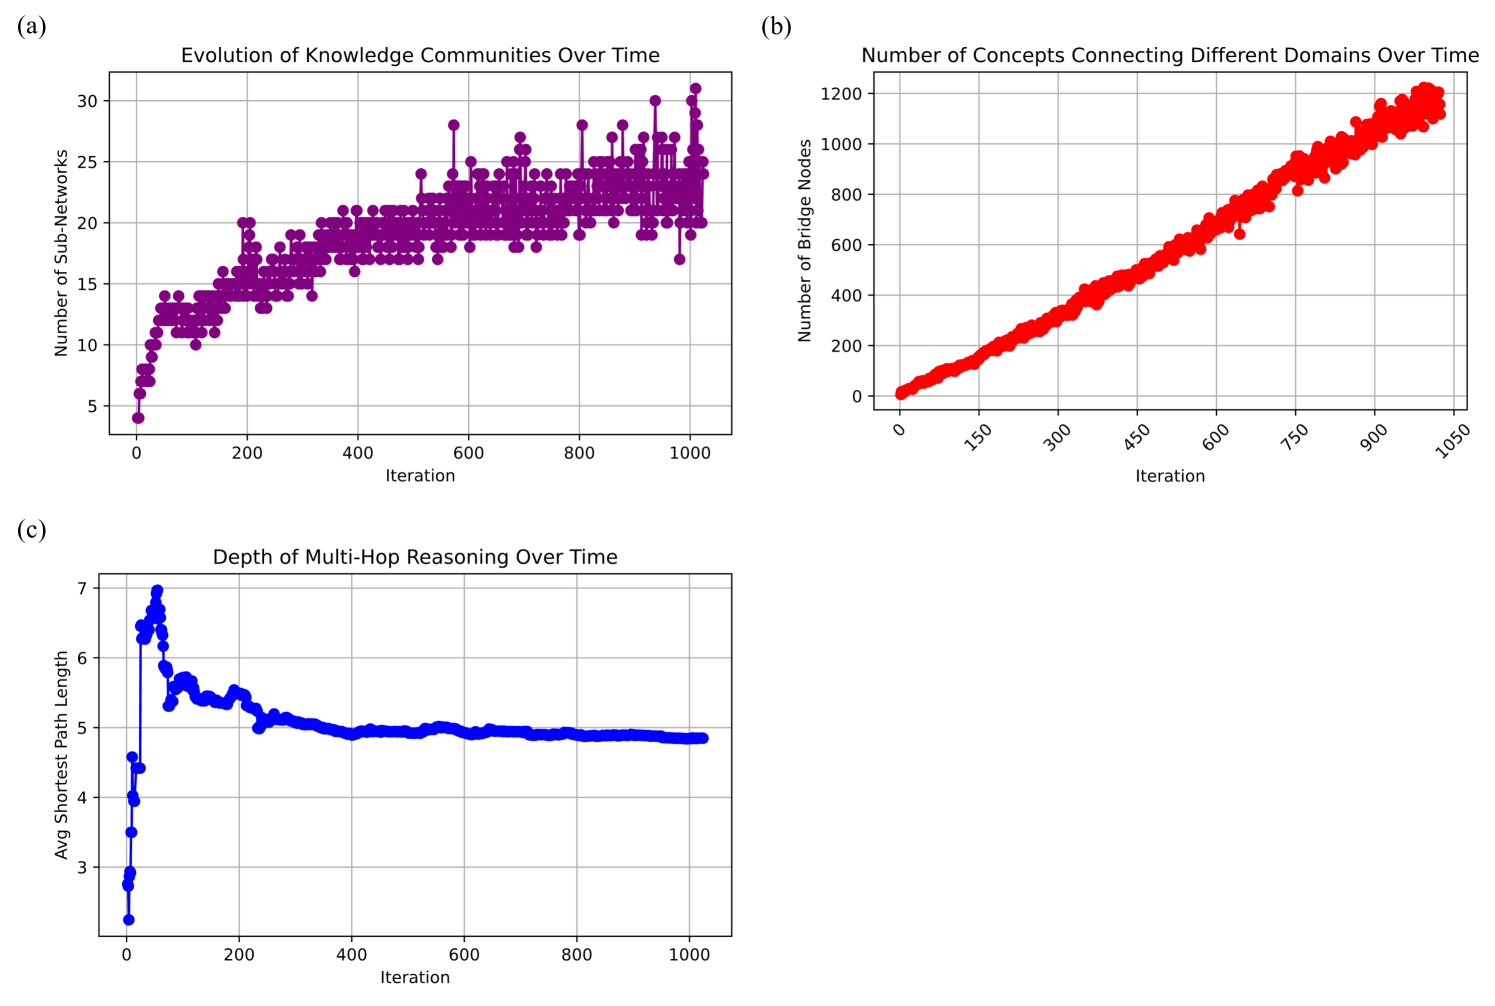
The image consists of three distinct line charts arranged in a 2x2 grid layout, with the bottom-right quadrant empty. The charts are labeled (a) in the top-left, (b) in the top-right, and (c) in the bottom-left. All text is in English. The charts collectively illustrate the evolution of different network or knowledge graph metrics over a period of approximately 1000 iterations. There are no explicit legends; instead, each chart utilizes a distinct color (purple, red, blue) for its data series.
---
### Component Isolation & Detailed Analysis
#### Chart (a) - Top-Left
* **Title:** Evolution of Knowledge Communities Over Time
* **Color/Style:** Purple line with circular markers.
* **Y-Axis:** Labeled "Number of Sub-Networks". Scale ranges from 5 to 30, with major gridlines and tick marks at increments of 5 (5, 10, 15, 20, 25, 30).
* **X-Axis:** Labeled "Iteration". Scale ranges from 0 to 1000, with major gridlines and tick marks at increments of 200 (0, 200, 400, 600, 800, 1000).
* **Visual Trend:** The purple line exhibits a logarithmic-style growth curve characterized by increasing volatility. It begins low, rises sharply in the first 200 iterations, and then continues to trend upward at a slower rate. As iterations increase, the vertical spread (variance) of the data points becomes significantly wider, indicating rapid fluctuations in the number of sub-networks.
* **Data Points (Approximate):**
* Iteration 0: ~4
* Iteration 100: Fluctuates between ~10 and ~14
* Iteration 200: Fluctuates between ~13 and ~20
* Iteration 400: Fluctuates between ~16 and ~21
* Iteration 600: Fluctuates between ~18 and ~28
* Iteration 800: Fluctuates between ~19 and ~28
* Iteration 1000: Fluctuates between ~17 and ~31 (highest variance observed here)
#### Chart (b) - Top-Right
* **Title:** Number of Concepts Connecting Different Domains Over Time
* **Color/Style:** Red line with circular markers. The line appears thick due to the high density of data points.
* **Y-Axis:** Labeled "Number of Bridge Nodes". Scale ranges from 0 to 1200, with major gridlines and tick marks at increments of 200 (0, 200, 400, 600, 800, 1000, 1200).
* **X-Axis:** Labeled "Iteration". Scale ranges from 0 to 1050, with major gridlines and tick marks at increments of 150 (0, 150, 300, 450, 600, 750, 900, 1050). The numerical labels on this axis are rotated approximately 45 degrees counter-clockwise.
* **Visual Trend:** The red line demonstrates a strong, consistent, and almost perfectly linear upward trend. The variance (thickness of the line band) increases only slightly as the iterations progress, indicating a highly stable growth rate.
* **Data Points (Approximate):**
* Iteration 0: ~0 to 10
* Iteration 150: ~150 to 200
* Iteration 300: ~300 to 350
* Iteration 450: ~450 to 500
* Iteration 600: ~600 to 700
* Iteration 750: ~800 to 900
* Iteration 900: ~1000 to 1100
* Iteration 1050: ~1100 to 1200
#### Chart (c) - Bottom-Left
* **Title:** Depth of Multi-Hop Reasoning Over Time
* **Color/Style:** Blue line with circular markers.
* **Y-Axis:** Labeled "Avg Shortest Path Length". Scale ranges from 2 to 7, with major gridlines and tick marks at increments of 1 (2, 3, 4, 5, 6, 7).
* **X-Axis:** Labeled "Iteration". Scale ranges from 0 to 1000, with major gridlines and tick marks at increments of 200 (0, 200, 400, 600, 800, 1000).
* **Visual Trend:** The blue line shows a dramatic initial spike followed by a rapid decay and eventual stabilization. It starts at the lowest point on the graph, shoots up to its maximum peak within the first ~50 iterations, drops sharply, and then slowly asymptotes to a flat, stable line just below the value of 5 for the remainder of the iterations.
* **Data Points (Approximate):**
* Iteration 0: ~2.2
* Iteration ~50 (Peak): ~7.0
* Iteration 100: ~5.3
* Iteration 200: ~5.5
* Iteration 400: ~4.9
* Iteration 600: ~4.9
* Iteration 800: ~4.9
* Iteration 1000: ~4.8
---
### Key Observations
1. **Divergent Volatility:** While Chart (b) shows incredibly stable, linear growth, Chart (a) shows increasing instability and variance over the same time period.
2. **Early System Shock:** Chart (c) reveals a massive structural shift in the network at the very beginning of the process (iterations 0-100), which resolves into long-term stability.
3. **Correlated Stabilization:** The stabilization of the average shortest path length in Chart (c) (around iteration 400) coincides with the period where the number of sub-networks in Chart (a) begins to experience its highest volatility.
---
### Interpretation
These charts likely represent the training process or dynamic evolution of an AI model, specifically one dealing with Knowledge Graphs, semantic networks, or multi-hop reasoning systems (like a Graph Neural Network or an LLM building internal representations).
* **Community Formation (Chart A):** The system is actively clustering information into distinct "sub-networks" or topics. The increasing volatility suggests that as the system learns more, it constantly re-evaluates these clusters—splitting them apart and merging them together dynamically. It is not settling on a rigid taxonomy, but maintaining a fluid, evolving categorization.
* **Interconnectivity (Chart B):** Despite the fracturing of knowledge into distinct communities (Chart A), the system is simultaneously and consistently building "bridge nodes" (concepts that link different domains). The linear growth implies a steady, healthy integration of cross-disciplinary knowledge. The system is not becoming siloed.
* **Reasoning Efficiency (Chart C):** The "Avg Shortest Path Length" is a classic measure of network efficiency (the "small-world" property).
* *The Initial Spike:* When the system first starts learning (iterations 0-50), it likely ingests disparate pieces of information, creating long, inefficient chains of logic to connect concept A to concept B (path length jumps to 7).
* *The Stabilization:* As the system builds more "bridge nodes" (as seen in Chart B), it creates shortcuts between different domains. This causes the average path length to drop and stabilize around 4.8.
* **Synthesis:** Reading between the lines, this data demonstrates a highly successful network evolution. The system is simultaneously becoming more specialized (more sub-networks) and more integrated (more bridge nodes). Because of this steady integration, the system maintains a highly efficient reasoning depth (a stable path length of ~5), meaning it can connect any two disparate concepts across its entire knowledge base in roughly 5 logical steps, regardless of how large the total network grows.
DECODING INTELLIGENCE...